
Introduction
The international financial crisis unleashed in the wake of Lehman Brothers’ demise signalled a turning point in the global economy. The crisis knocked the world economy from its high growth rails and plunged it onto a path littered with systemic imbalances and monetary and financial uncertainty. Looking at the figures, the impact of the crisis is surprising. Until the crisis, performance was enviable: with annual growth one and-a-half points higher than that of previous decades, the magic of compound interest made global economic growth spiral well above its historical pattern. In 2000-08, global GDP increased by 50%, whereas in the 1980s and 1990s it had grown between 25% and 30%. Following the collapse of high-risk financial markets in the US at the end of 2008, however, the global economy shrank by almost 1% in 2009.
Performance in Latin America was not immune to the turmoil. Between 2003 and 2008 per capita GDP increased systematically every year at an average of 4% per annum. On the back of this strong growth, the region was able to resume the process of convergence with advanced economies that had been reversed following the debt crisis in 1982. A notable characteristic of the expansion was that it was quite widespread. For example, all the countries in Latin America and the Caribbean registered positive growth in 2007-08. There has not been a similar performance since the end of the 1960s. As in the rest of the world, the international crisis put an end to this period of strong growth: regional per capita GDP shrank by 2.9% in 2009.
The financial crisis and its effects radically transformed the international stage and this transformation calls for adaptive responses on the institutional and policy front. This paper’s purpose is to reflect on the implications of the changes in the global scenario for Latin America. With this aim in mind, it analyses the effects of the financial turmoil at the end of 2008 and the consequences of the subsequent recovery. The emphasis is on the size and characteristics of the external shocks endured by the region, its vulnerability to them and the political responses they elicited.
The paper is structured in three sections. Section II examines the mechanisms that operate as conduits spreading the crisis to the region and the relative performance of Latin American economies in the subsequent period of recovery. One very significant factor is that the imbalances in the global economy had different consequences on different countries, depending on their degree of international insertion. In the specific case of Latin America, the differences can be better understood by dividing the region into two large groups or sub-regions: the South American countries (LAS), rich in natural resources, and the rest (LAN), whose insertion is more dependent upon factors like remittances and manufacturing. Section III overviews the region’s performance (and that of the sub-regions) in relation to its own history, and discusses whether it is true, as is often claimed, that ‘this time it was different’. The approach is to evaluate the significance of the shocks, the region’s vulnerability and the existence of political scope with which to respond to macroeconomic imbalances. Section IV contains some conclusions and remarks on the challenges ahead.
Latin America and the Subprime Crisis
This section presents evidence regarding the size and repercussions of the global crisis. In the first place, it shows the effects on the levels of activity and highlights the differences between the world’s advanced and emerging economies. Secondly, it looks at the channels through which the contagion spread from its epicentre in the US to the rest of the world. It examines both the financial and the real channels and focuses on the case of Latin America. Lastly, it gauges the impact of the crisis and the recovery in the region, based on the performance of activity globally and in other regions.
The Crisis, Growth and Contagion Channels
The global instability unleashed by the collapse of the US mortgage market brought a trend of high growth in the global economy to an abrupt halt. Global activity shrank by 0.6% in 2009, after growing by rates of close to 4.4% per year between 2003 and 2008 (see Figure 1a). The recession began in the final quarter of 2008 and continued into the second quarter of 2009, before giving way to the recovery. The advanced economies were worst hit: they contracted 3.2% in 2009. Emerging growth, in contrast, did not move into negative territory despite seeing considerable deceleration. Growth slowed from 7.3% in 2003-08 to 2.5% in 2009. This gap in relative performance was seen again during the recovery, when the emerging world recovered twice as fast as the advanced economies.
The income gap between the emerging and developed countries had tended to close in the 2000s, and this did not change with the crisis. As shown in Figure 1b, the emerging economies, which provided one-third of economic growth during the 1980s and early 1990s, accounted for almost two-thirds of growth in activity in 2003-07. The evidence on the crisis and the recovery has so far confirmed that multiple speeds persist (see Canuto, 2010). The International Monetary Fund (IMF) estimates that towards 2012 the emerging economies as a whole will produce more than the advanced economies.
Figures 1a, 1b, 1c and 1d. The real and global effects of the subprime crisis
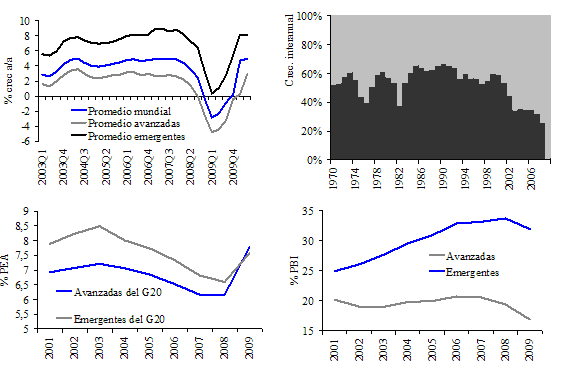
(b) Contribution to global growth (black: developed countries; grey: emerging countries).
(c) Unemployment rate.
(d) Investment rate.
Source: own research based on IMF and OECD data.
The contraction in activity had two crucial consequences for the real economy: the rise in the unemployment rate (Figure 1c) and the fall in the pace of physical capital accumulation (Figure 1d). Again, in developed economies the effect was stronger: the unemployment rate increased from 5.7% to 7.9% between 2008 and 2009, according to OECD data. The peak was recorded in European countries like Spain, Ireland and Slovakia, where the unemployment rate reached double digits and remained comfortably installed there. The emerging world, which had combined faster growth with a sharp reduction in unemployment rates, saw that trend reversed when the crisis began. The investment rate, a key indicator of the maximum or potential product which an economy will generate in future, slumped in 2009, after peaking in 2008 (33.5% and 20.2% of GDP in emerging and advanced economies, respectively).
There were many financial and real mechanisms that spread the US financial turmoil to the rest of the world. With regard to finances, the most direct effect was linked to the operation of global banks in high-risk financial markets abroad, although the contagion was limited to developed countries like Germany and the Netherlands (Acharya & Schnabl, 2010). In contrast, the transmission was more generalised through another channel: the reduction in global risk appetite (see IMF 2009a). The repricing of risk in emerging markets triggered a jump in the spread, which widened from 280 basis points in July 2008 to 860bp at the end of October 2008 (Figure 2a). Equity markets also felt the impact of the global collapse, having rallied strongly in the previous months.
Figures 2a, 2b, 2c and 2d. How the subprime crisis went global
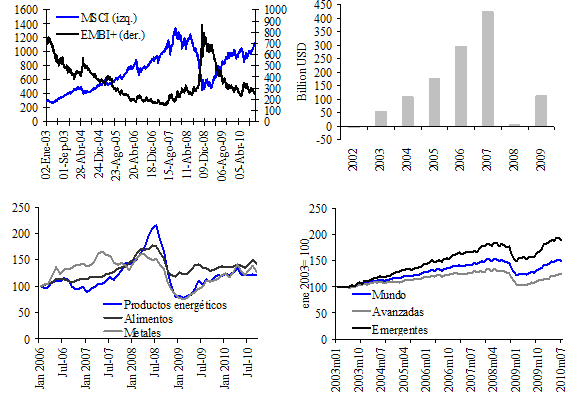
(b) Financing flow to emerging economies.
(c) Commodities prices.
(d) Volume of exports.
Source: own research based on IMF, CPB and CEI data.
Aside from the collapse in asset prices, the emerging world was also hit by the slump in external financing. According to estimates by the Institute of International Finance (see Figure 2b), financing flows towards emerging economies slumped from US$423 trillion in 2007 to only US$4.5 trillion in 2008. This sudden stop in financing came through both markets and banks. This is important because, as we are seeing in the recovery, the former are more volatile and adjust quickly to changes in risk appetite. Banking institutions, in contrast, provide more stable financing. In other words, the fact that international banking flows were affected suggests persistent effects of the subprime crisis.
On the real side, international contagion mechanisms were also varied. One effect simultaneous to the crisis was the collapse in commodities prices (Figure 2c). In the months leading up to the global collapse, energy product prices and – to a lesser extent, food prices – soared, but later tumbled when the global “stop” hit and the flight to quality began (Caballero et al, 2008). For commodity-exporting economies, like many in Latin America, this exerted substantial pressure on the balance of payments, which was already experiencing tensions on the capital account side due to the financial collapse.
The effects with the largest impact, however, were linked to the synchronised and sharp fall in the volume of international trade. Estimates by the Netherlands Bureau for Economic Policy Analysis (see Figure 2d) show a contraction in export volume of close to 18% in the first quarter of 2009 with respect to the same period in 2008. The recovery was accompanied by a slower restructuring of international trade than of finances, so that 2009 closed with a decline of 14%. Note also the global nature of the trade crash as expressed by the high correlation between exports in the emerging and advanced economies.
Latin America and the Channels for Transmitting the Global Imbalances
What happened with contagion in Latin America? A quick glance at events pertaining to the financial channel shows that it was substantial, even though in many cases the direct effect was relatively small, considering the region’s financial underdevelopment. However, the two largest and most dynamic economies in terms of financial innovation –Brazil and Mexico– had problems due to major corporations’ currency exposure to derivative markets (Fahri & Zanchetta, 2009).
A more widespread contagion channel operated via increases in the cost of external financing, which were considerable in the first few months of the crisis (Figure 3a). Latin American governments, which in early 2008 paid for their liabilities a rate of between two and three points above the rate paid by the US Treasury, saw that rate treble in the next few months. Among the seven major economies (Argentina, Brazil, Chile, Colombia, Mexico, Peru and Venezuela; hereinafter LAC7), Venezuela and Argentina performed worst. In Argentina, the risk premium rose to the levels seen just before the default in 2001-02, and in Venezuela this variable remained systematically above 1000 basis points. In the rest of LAC7 countries, in contrast, while the impact of the crisis was clearly noticeable, once the period of major turmoil in developed countries had passed, sovereign risk began to fall in accordance with the movement of emerging markets as a whole.
The decline in external financial conditions also had an impact in the form of rationing: many countries in the region were denied access to international markets. On the one hand, loans (syndicated and others) from global banks fell by 40% in the last quarter of 2008 with respect to the same period in 2007 (Jara et al, 2009). The impact of this was particularly severe on Central American countries (which are classified along with Mexico in the LAN sub-region), where the financial systems are bank-intensive and foreign penetration is high (Swiston, 2010). Furthermore, debt markets also collapsed with the global crisis: while in the first half they issued US$40 billion in bonds, in the second half of the year they issued only US$18 billion. During the recovery, markets restructured relatively quickly, although bank financing was somewhat slower to react.
Figures 3a, 3b, 3c and 3d. Contagion to Latin America
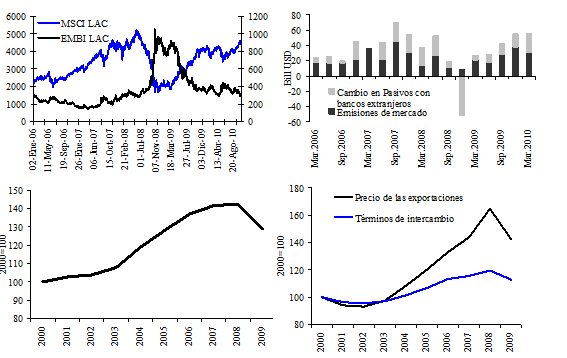
(b) External financing.
(c) Volume of exports.
(d) Foreign trade prices.
Source: own research based on IMF, ECLAC, CPB and BIS data.
On the trade side, the crisis dramatically reduced the entry of currency from foreign sales. On average, Latin America saw its export revenues slump by 23% in 2009. The impact was by no means small: it was the biggest decline since the Great Depression (between 1931 and 1932 exports fell by a massive 40%; see Díaz Alejandro, 1985). The collapse was due to a decline in both amounts (which shrank by 11% –see Figure 3c–) and prices (which explain the remaining 11% of the fall in total revenues –see Figure 3d–).
The contagion via trade was not strictly homogeneous. Countries specialising in basic commodities and fuels, which had experienced a boom in terms of exchange in 2003-07, were also those that recorded a bigger decline in terms of exchange. Indeed, for South American countries (the LAS sub-region) three-quarters of the decline in export revenues is explained by the downturn in export prices (ECLAC 2010a). The countries of the Central American Common Market, fuel importers and manufacturing product importers, saw their terms of exchange increase in 2009, unlike what had happened in 2003-07.
Two other differences between LAS and LAN countries deserve to be highlighted for their crucial role in defining the scale of the crisis’ impact. The first has to do with the geographical orientation of exports and the trend of global growth. Towards the early 1990s both South and North Latin America had little trade with Asia: China as a destination of exports accounted for less than 1% of the total. With Asia’s emergence as a global growth driver international trade changed and differences appeared in Latin America: while for the LAS countries Asia became more important, this was not the case in LAN countries (with the exception of Costa Rica). So much so, that in 2008, 9% of LAS exports went to China, while just 3% of LAN sales did (Rosales, 2010). Obviously, relative specialisation was the key: global demand for commodities is increasingly linked to Chinese growth. According to IMF estimates, China accounts for 28% of global demand for copper, 22% of demand for soybeans and 9% of demand for oil; a decade ago it accounted for 10%, 11% and 4%, respectively (IMF, 2010b).
The second differentiating factor is linked to the role of remittances in the performance of the balance of payments. In LAN countries transfers from workers resident in the US are one of the main sources of foreign currency. Indeed, in countries like Honduras, Haiti and El Salvador remittances account for 15%-20% of GDP and close to 80% come from the US (Ratha & Shaw, 2007). In this regard, the outlook for the North American economy in terms of demand and employment are pivotal to these economies.
The Crisis and Recovery in Latin America
The region’s macroeconomic performance during the crisis was quite positive, in relation to both the other regions in the world and their own past instability (this latter subject will be discussed in section III).
The level of activity was affected by the crisis, but the consequences were less severe than those observed in advanced economies. Industrial activity, for example, shrank by 11% on average in LAC7 countries between September 2008 and May 2009, while in G-7 countries the reduction was 18% (Figure 4a). In the region, the most affected country was Brazil. In the following months industry recovered worldwide, but there were also differences in the region’s favour here: while in LAC7 the peak prior to the crisis came in March 2010, in advanced economies the preliminary data in August 2010 tells us that this has not yet been reached.
The installation of strong recessive trends obviously had effects on the variables that are sensitive from the social standpoint. The unemployment rate, as we have seen, soared in rich countries and reached double-digits towards the final quarter of 2010. In the countries of the region unemployment also increased as a result of the international crisis, although to a lesser extent than in the advanced world (Figure 4b and ECLAC and ILO, 2010). The evidence on the recovery, meanwhile, shows that unemployment rates in the region have continued in the downward pre-crisis trend, while in the advanced economies the labour market is still beset with problems.
Figures 4a, 4b, 4c and 4d. Macroeconomic performance in Latin America during the crisis
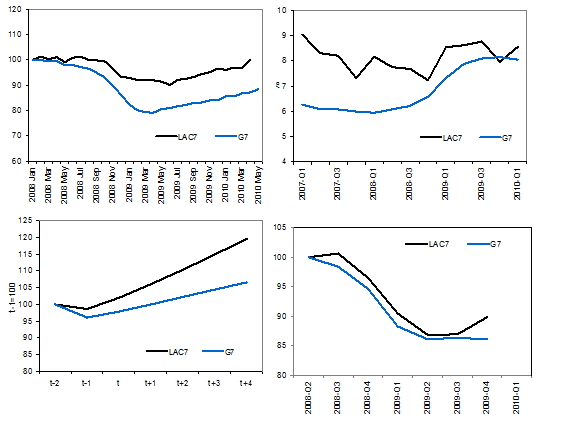
(b) Unemployment rate.
(c) GDP projection.
(d) Investment rate.
Note: LAC7 = Argentina, Brazil, Chile, Colombia, Mexico, Peru and Venezuela.
Source: own research based on IMF, OECD and ECLAC data.
What are we to expect with regard to the region’s future performance? To answer this question we have used IMF estimates (Figure 4c). According to the projections, in line with what has happened so far, the recovery will be quicker. This means that the growth trend spearheaded by the aforementioned emerging countries is expected to persist. This has implications for macroeconomic convergence between regions: between 2003 and 2008 the region’s countries were closing the gap on advanced countries by 2% per year, between 2009 and 2010 they are expected to do so at a rate of 1.5% per year, and between 2011 and 2015 at 1% per year. If these projections are fulfilled, in just over a decade the region will have reduced the gap by a quarter with respect to 2003. The evidence on investment rates, as a proxy of potential future GDP, is consistent with the hypothesis of continued convergence between the regions (Figure 4d).
So will the region be definitively placed in the group of dynamic emerging economies –which grew faster in 2003-08, fell less during the crisis and are expected to grow further– together with some African countries and the Asian world? While the answer might be yes, it is also necessary to take into account the considerable heterogeneity among the emerging countries; a characteristic that is by no means unique to Latin America. More specifically, Asia clearly stands out among the rest. Between 2003 and 2008 the contribution by emerging countries to the global product increased from 39% to 45%; of the additional 6%, 4% can be explained by the advance in Emerging Asia, while Latin America contributed just 0.3%. During the subprime crisis the divergence increased: only Emerging Asia and, to a lesser extent, the Middle East, increased their contribution to global GDP.
To shed some more light on the issue of heterogeneity, Figure 5 shows the empirical distribution function of growth rates of the countries of each region, during both the expansion phase (Figure 5a) and the recent recessive phase (Figure 5b). Interestingly, during the expansion, average growth in Asian countries was significantly higher than in Latin America, which in turn outperformed the advanced economies. As we look at regions with higher growth, we see more heterogeneity. When the crisis erupted, average growth rates fell significantly and only Emerging Asia remained in positive territory. Aside from increasing heterogeneity, what is interesting is that there is stochastic dominance in the sense that the outperformance in Asia was greater during the crisis, both for those which did well and for those which fared badly.
Figures 5a and 5b. Three-speed global growth trend: Asia, Latin America and the advanced economies
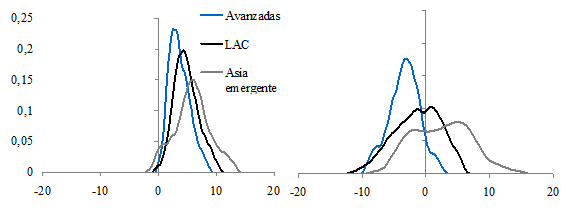
(b) Crisis (2009).
Note: LAC = Latin America and the Caribbean.
Source: own research based on IMF data.
Latin America’s growth trend also shows heterogeneity. Between 2003 and 2008, the overall GDP of the countries in the LAN sub-region expanded at rates of close to 6.5% per year, while in LAS the rate was 8%. During the crisis, GDP in LAN countries shrank by 3%, while in the south it expanded by 0.6%. This divergence in both recessions and expansions has the additional ingredient of greater uniformity between southern countries, unlike the northern group where the evidence is not as conclusive (Figure 6).
Moreover, it is worth highlighting that both in the case of the global economy and in Latin American economies there is an increase in the variance of the distribution of probabilities, which may point to a differentiation process within the group of countries depending on how they are impacted, in view of their international insertion, their vulnerability and the scope for policies to respond to shocks. Accordingly, we will now analyse these factors in more detail in the case of Latin America.
Figures 6a and 6b. Two-speed global growth trend: southern and northern Latin America
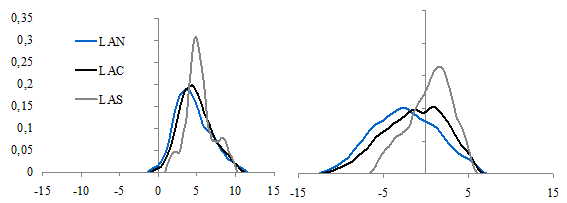
(b) Crisis (2009).
Note: LAC = Latin America and the Caribbean; LAN = Costa Rica, El Salvador, Guatemala, Honduras, Mexico, Nicaragua, Panama and the Dominican Republic; LAS = Argentina, Bolivia, Brazil, Chile, Colombia, Ecuador, Peru, Uruguay and Venezuela.
Source: own research based on IMF data.
Latin America and the Global Crisis
One way to assess the impacts and scope of the crisis in 2008-09 is to use other similar past events in the region for comparison. In the case of Latin America, this strategy appears to be quite reasonable since it is a region which, on the one hand, has proved to be macro-economically quite sensitive to external turmoil and, on the other hand, it has endured sizeable global shocks in the last few decades (Izquierdo et al, 2008; ECLAC, 2008). In this regard, it is worth noting that, as the so-called ‘second globalisation’ was consolidated in the wake of the fall of the Bretton Woods regime, the influence of international disruptions increased. Consequently, while under the Bretton Woods rules crises were relatively rare occurrences, during the second globalisation crises became more frequent and aggregate volatility increased considerably. In particular, Latin America experienced three periods of high instability linked to global shocks in the last few decades: the 1982 debt crisis, the emerging countries’ crisis of the 1990s and the current crisis (IMF WEO of April 2009). However, it should be pointed out that although in Latin America the frequency and depth of crises tended to be greater than in the rest of the world, the occurrence of episodes of considerable instability was quite widespread throughout the world (Bordo & Lane, 2010).
Accordingly, we will now assess the region’s performance in the wake of the subprime crisis, using as the basis for comparison the episodes of regional instability linked to the 1982 debt crisis and the emerging economies’ crises in the 1990s (the key episodes of which were the Asian crisis in 1997 and the Russian crisis in 1998). We will start by comparing GDP performance during the three episodes of instability. This comparison will show that Latin America amply outperformed the rest of regions in the most recent episode. With this evidence as a framework, we will analyse the factors that are pivotal to gauging an economy’s capacity to respond to a stress situation: (a) the size and characteristics of the external shock; (b) the degree of domestic macroeconomic vulnerability at the time of receiving the shock; and (c) the political scope to implement anti-crisis measures once the shock has occurred.
The Impact on Growth: This Time it was Different
In section II we saw that the region bore the subprime crisis quite well compared to other regions. The data point to the same conclusion when we compare this crisis with past episodes of instability. Activity was affected, but the impact was far from being as dramatic as on previous occasions (BID, 2009; Kacef, 2010). To examine this point we have drawn a series of charts showing the average performance of regional activity in the context of recessions linked to external instability. Figure 7 shows the performance of GDP in the case of all three crises, both at aggregate level for all the Latin American countries and in terms of the two sub-regions under analysis. Base 100 represents the level of activity in the period prior to the start of the recession.
Figures 7a, 7b and 7c. Crisis and recovery of real GDP in Latin America
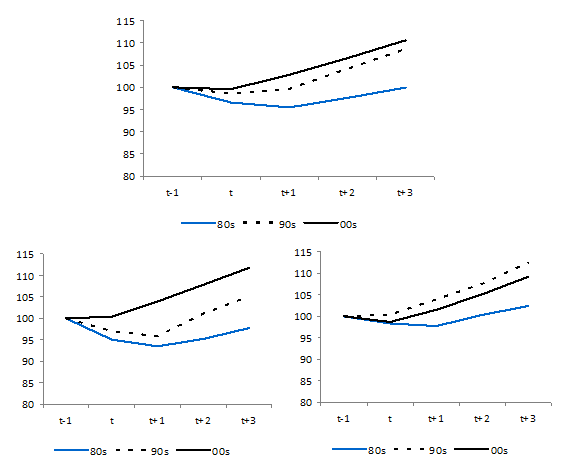
(b) LAS.
(c) LAN.
Notes: LAN = Costa Rica, El Salvador, Guatemala, Honduras, Mexico, Nicaragua, Panama and the Dominican Republic; LAS = Argentina, Bolivia, Brazil, Chile, Colombia, Ecuador, Peru, Uruguay and Venezuela; the projections are taken from the IMF.
Source: own research based on IMF data and WDI.
The most salient contrast was clearly between what happened in the 1980s and in 2000. As a result of the crisis in the early 1980s GDP collapsed by an average of 5%, remained stagnant for several years and only recovered its previous level five years after the crisis. Not in vane was the decade of the 1980s christened the Lost Decade. In contrast, in the current episode GDP fell by just 0.6% and resumed its growth trend quite quickly. According to IMF projections, growth in activity will barely be lower in the five years after the crisis than in the five years immediately before it. If this proves to be the case, the contrast with the performance in the wake of the debt crisis would be even more impressive: in the 1980s the recovery came four times more slowly than in the previous growth phase (for a discussion on recoveries from crises see Cerra & Saxena, 2007). The current performance also compares favourably with the episode of instability during the 1990s. In particular, the faster speed of the recovery is worth highlighting.
According to Reinhart & Reinhart (2010), a typical characteristic of post-crisis episodes is the persistence of a period of instability. If we use this criterion to assess what is happening, we should conclude that, while the region endured a crisis in the 1980s, it is not clear that that is the case now, since, in principle, the signs of instability have not persisted. However, it is worth pointing out that the global economy is still showing high levels of uncertainty and, as a result, it is not advisable to draw hasty conclusions. The macroeconomic turmoil in Europe and the US and the process to redress global imbalances are likely to remain a source of global shocks.
However, this general framework conceals some important differences which are evident when the sub-regions are examined separately. It is important to take these differences into account when evaluating the region’s possible future performance. In LAS countries, which are rich in natural resources, the post-crisis recovery is faster and more robust than in LAN countries, which are more linked to the performance of activity and employment in the US, through industrial exports and remittances (Figure 7b and 7c). While both groups are performing much better than during the instability of the 1980s, the same cannot be said compared to the 1990s. In the LAN group, imbalances in the US triggered a greater recession than during the instability of the 1990s; in fact, the LAN group evidenced significant recovery capacity in those years. This contrasts starkly with the performance by the four leading economies in the LAS sub-region (Argentina, Brazil, Colombia and Venezuela); GDP slumped by 5% on average as a result of emerging instability at the end of the last century, and it took these countries three years to resume their previous levels of activity.
This suggests that the degree of vulnerability of the LAN and LAS sub-regions to global shocks is not the same and that the degree of insertion in international trade probably plays a decisive role in explaining the differences. Consequently, it is worth looking at the characteristics of the shocks which have affected the region.
The Scale of External Shocks
As shown above, international trade and finance operated as major transmission channels of the international crisis towards Latin America, both because of the lower volume of trade and the lower price of commodities and because of the reversal of capital flows and volatility of returns.
We will start by analysing how the trade shocks triggered by the events of 2008-09 compare with those observed in previous episodes.
To gauge the scale of the disruptions to trade it is necessary to adopt a standard of ‘normality’ for export volume. With this purpose in mind we will use the deviations with respect to the long-term growth rates of amounts exported, using observations of growth in the volume exported at an annual frequency for the period 1980-2009. The threshold from which it is considered to be an exceptionally strong or unusual shock is a standard deviation. When the performance of a given period is above a deviation there is considered to be boom in real trade and when it is below there is considered to be a crash. Another way to characterise the scale of a shock is to evaluate the degree of ‘spillage’ through the region and sub-regions. We will say that a crash or boom is generalized if it affects more than 25% of the countries in each group/subgroup. Figure 8 shows the evidence analysed; the dotted lines show the threshold of a standard deviation.
Figures 8a, 8b, 8c and 8d. Exceptional real trade shocks in Latin America
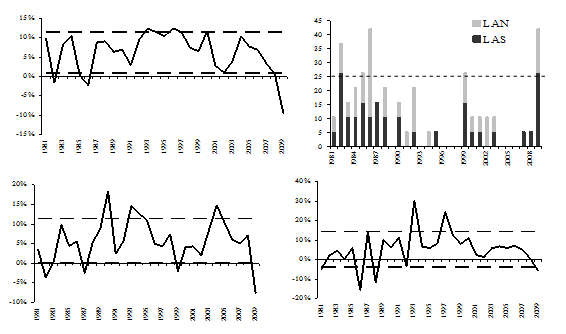
(b) Proportion of countries where the event took place.
(c) LAS.
(d) LAN.
Notes: LAC = Latin America and the Caribbean; LAN = Costa Rica, El Salvador, Guatemala, Honduras, Mexico, Nicaragua, Panama and the Dominican Republic; LAS = Argentina, Bolivia, Brazil, Chile, Colombia, Ecuador, Peru, Uruguay and Venezuela.
Source: own research based on ECLAC data.
The evidence clearly indicates that there has been an exceptionally strong negative trade shock linked to the subprime crisis. As Figure 8a shows, similar ‘abnormal’ situations had not been recorded since the early 1980s. Furthermore, note that as in the case of the Lost Decade, the crash was widespread: a broad set of economies in both sub-regions was affected (Figure 8b).
When comparing the significance of the shock in the case of the sub-regions we are looking at, this is also the case: both sub-regions experienced significant real trade crashes and both had experienced them in the 1980s. An interesting point is that in the period of instability during the 1990s, international trade in the LAS region was more severely punished (Figure 8c). This probably partly explains the better performance in activity in the LAN sub-region in the 1990s.
What happened with the terms of trade exchange? Figure 9 applies the technique already used to detect a crash in real trade to the case of the terms of exchange. Once again, for Latin America as a whole, because of its scale and its synchronisation from one country to the next, the current situation reminds us of the early 1980s; then there were no crashes in the terms of exchange. However, in the case of the LAS sub-region, there was an episode at the end of the 1990s. Moreover, it is interesting to note the clear difference in the last decade: while in the southern countries the volatility of external price shocks increased, in the LAN sub-region the opposite occurred. Furthermore, the profound difference in foreign trade profiles was neatly portrayed in 2009, when, as the crisis emerged, the exchange terms moved in opposite directions.
Figures 9a, 9b, 9c and 9d. Trade price crash in Latin America
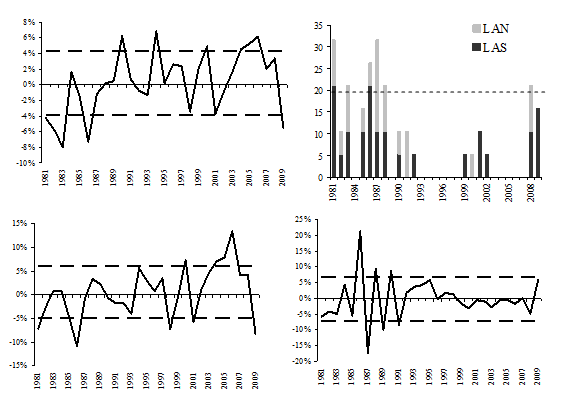
(b) Proportion of countries where the event took place.
(c) LAS.
(d) LAN.
Notes: LAC = Latin America and the Caribbean; LAN = Costa Rica, El Salvador, Guatemala, Honduras, Mexico, Nicaragua, Panama and the Dominican Republic; LAS = Argentina, Bolivia, Brazil, Chile, Colombia, Ecuador, Peru, Uruguay and Venezuela.
Source: own research based on ECLAC data.
How important were the shocks of financial origin associated with the subprime crisis when evaluated from a long-term standpoint? One way to shed light on this question is to look at whether or not there was a sudden outflow of capital that placed the region on the path to a sudden stop in the sense intended by Calvo et al (2008). Figure 10 presents some evidence in this regard. The indicator shown computes the performance of net capital inflows defined as the difference between the change in reserves and the trade balance. Calvo identifies a situation as a sudden stop provided there is a net outflow (negative inflow) and the flows have fallen below a minimum threshold; a minimum threshold defined as the average of the 1980-2009 period less a standard deviation. The figure also shows the proportion of countries that experience a sudden stop as a way of measuring the regional scope of the phenomenon.
Figures 10a, 10b, 10c and 10c. Sudden stops in Latin America
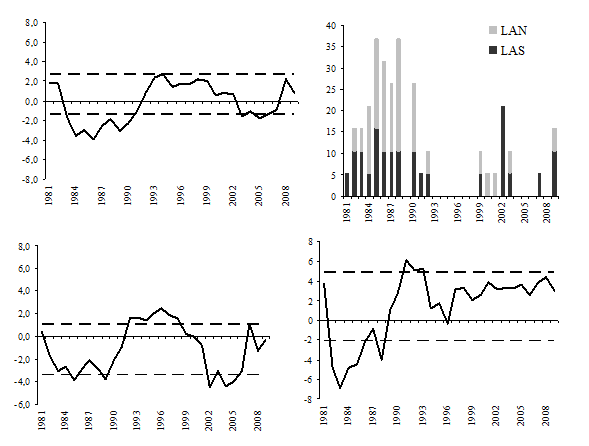
(b) Proportion of countries where the event took place.
(c) LAS.
(d) LAN.
Notes: LAC = Latin America and the Caribbean; LAN = Costa Rica, El Salvador, Guatemala, Honduras, Mexico, Nicaragua, Panama and the Dominican Republic; LAS = Argentina, Bolivia, Brazil, Chile, Colombia, Ecuador, Peru, Uruguay and Venezuela.
Source: own research based on ECLAC data.
The charts clearly show that, for the region as a whole, the financial shocks of the 1980s and 1990s were more severe than the current one: although in all three events there is a reversal in regional capital flows, the scale is considerably smaller in the case of the subprime crisis. In fact, although the reversal was significant, the phenomenon does not constitute a sudden stop for the region as a wholesince the amount of outflows does not fall below the minimum threshold. This is because, as we have seen, once the initial impact passed, capital tended to return to the region in the second half of 2009. This contrasts with what happened in the early 1980s and late 1990s in which the reversals did indeed constitute sudden stops. This picture does not change much when the observations are quarterly instead of annual. In Albrieu & Fanelli (2009) we applied a similar metric for quarterly series and we detected a regional sudden stop in the final quarter of 2008 and the first quarter of 2009. Aside from this, two South American economies (Bolivia and Peru) and one Central American economy (El Salvador) experienced a sudden stop, while another two (Argentina and Venezuela) experienced capital outflows prior to the international crisis.
While this can be observed in both LAN and LAS, the reversal was sharper in South America (Figures 10c and 10d). While in the latter region the reversal caused net capital flows to turn negative, this was not the case in LAN. However, what is true is that the reversal was quite widespread. The regional scope of the phenomenon is similar to the events of the 1990s (although not comparable to the events of the 1980s). The occurrence of sudden stops in a number of economies was reflected in Figure 10b, which shows the proportion of economies that endured the phenomenon in each sub-region.
Macroeconomic Vulnerability
A macroeconomic shock of given size and characteristics may have a very different impact depending on the vulnerability of the economy that receives it. Accordingly, as important as characterising the shocks is it to assess the risk factors that determine the degree of vulnerability (Edwards, 2007; ECLAC, 2008; Ocampo, 2009). In the specific case of external shocks, research shows that vulnerability is linked to a set of indicators relating to the fiscal, external and financial fronts (ECLAC, 2008). Accordingly, we will review a series of regional indicators that are linked to vulnerability. Naturally, we will take the period prior to the external shocks since vulnerability must be evaluated in ex-ante terms.
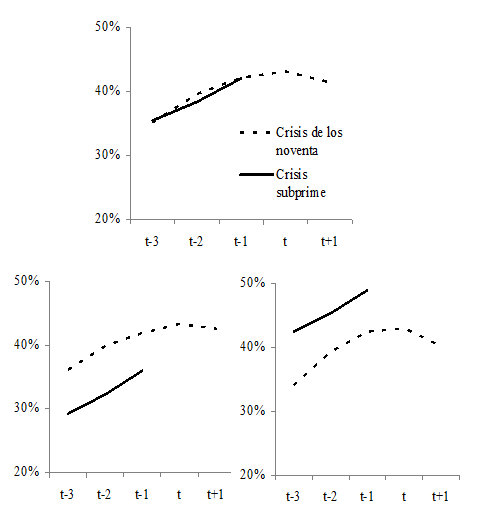
We will start by discussing fiscal vulnerability. The literature on sudden stops identifies as two key risk factors the relationship between public debt and GDP and the proportion of said debt that is dollar-denominated. As Figure 11 shows, public debt levels followed a downward trend in the years leading up to the crisis, so that when the global instability was unleashed, government debt obligations averaged 35% of GDP. In the 1990s, average public debt was more than 40% of GDP.
In the LAS sub-region the process of reducing debt was quite sharp, in particular in Argentina, Bolivia, Chile, Peru and Uruguay. However, because in general they were starting from relatively high levels (partly as a result of the crises at the end of the 1990s), this did not translate into particularly low government debt levels. In the LAN sub-region the pattern was similar. In particular, countries like Honduras and Costa Rica entered the current crisis with a strength they had not had in the past. Another very positive fact is that the indebtedness levels did not surge as a result of the instability triggered by the external shock, which contrasts sharply with that that had happened in previous episodes. See, in particular, the case of LAS, where levels of indebtedness spiralled as a result of the instability in the 1990s.
Figures 11a, 11b and 11c. Fiscal vulnerability in Latin America (I): stocks. Central government debt (% GDP)
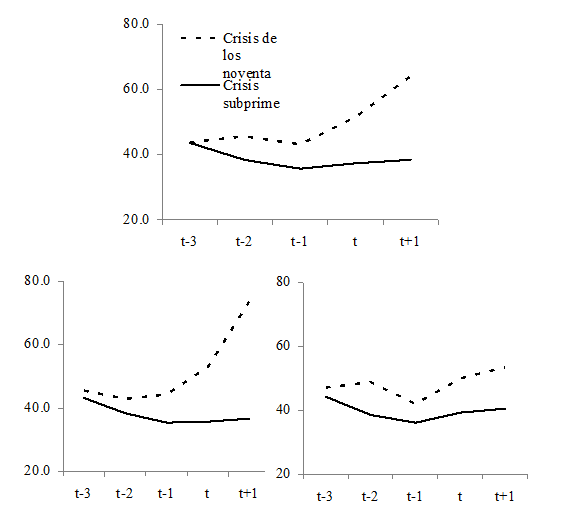
(b) LAS.
(c) LAN.
Notes: LAC = Latin America and the Caribbean; LAN = Costa Rica, El Salvador, Guatemala, Honduras, Mexico, Nicaragua, Panama and the Dominican Republic; LAS = Argentina, Bolivia, Brazil, Chile, Colombia, Ecuador, Peru, Uruguay and Venezuela.
Source: own research based on ECLAC data.
A fact that probably explains the post-shock improvement in public debt is the lower degree of dollarisation. Dollarisation of debt diminished notably in the region. In the early 1990s the proportion of Latin American governments’ debt denominated in foreign currency was 70%-75% of the total; in 2008, in contrast, it was just 50% (Cowan et al, 2006).
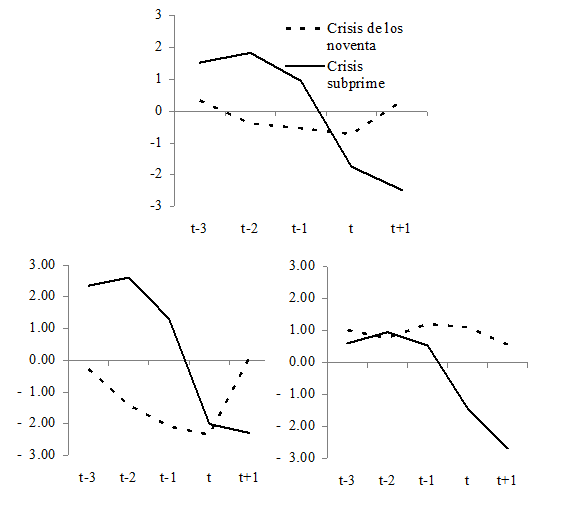
The flow indicators also show positive changes with regard to vulnerability (Figure 12). In the early 2000s the region’s economies were recording deficits averaging 3% of GDP. Following the aforementioned process to reduce debt, in around 2007 the balances turned into surpluses. Consequently, the advent of the subprime crisis found the region’s countries with more fiscal manoeuvring room than on previous occasions, when the fiscal balance was slightly in deficit (Figure 12a).
A sub-regional breakdown shows that the main differences came in the countries of the south. In fact, they began previous crises with sizeable fiscal deficits, of the order of 2% of GDP. However, this is not the case of the biggest economy in the sub-region (Brazil), which despite reducing its fiscal deficit notably, began the subprime crisis in the red. In the LAN sub-region, meanwhile, fiscal numbers when the crisis began were similar to those of past crises. However, it is worth noting that Mexico, the biggest economy of the region, has been showing much less fiscal vulnerability in the last few years.
In short, it is safe to say that the effect of fiscal vulnerability has been much less than in the past. Although the situation is far from being homogeneous in all the countries, the fact is that the region appears to have taken advantage of the boom of the 2000s to strengthen its fiscal position, in terms of both flows and stocks.
Figures 12a, 12b and 12c. Fiscal vulnerability in Latin America (I): flows. Central governments’ finance expense (% GDP)
Notes: LAC = Latin America and the Caribbean; LAN = Costa Rica, El Salvador, Guatemala, Honduras, Mexico, Nicaragua, Panama and the Dominican Republic; LAS = Argentina, Bolivia, Brazil, Chile, Colombia, Ecuador, Peru, Uruguay and Venezuela.
Source: own research based on ECLAC data.
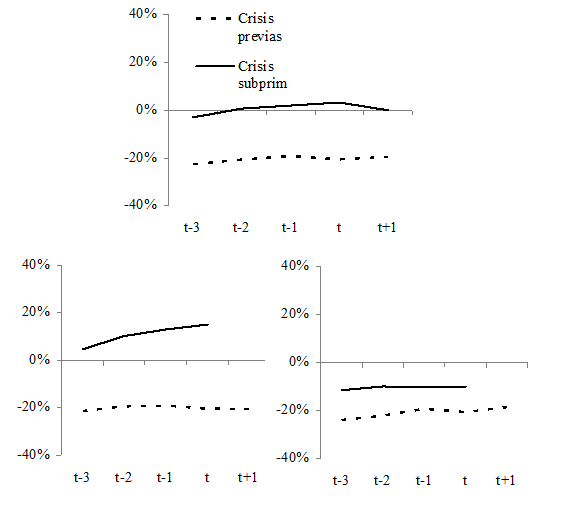
Let us now look at external vulnerability indicators. The figure below shows the performance of external vulnerability using as an indicator the net international financial investment position. This indicator is defined as the difference between external financial assets and financial liabilities of the economy as a whole. In the past, crises were accompanied by significant external fragility reflected in net financial obligations that amounted to around 20% of GDP. This time, though, on average, the region entered the subprime crisis with a net credit position in relation to the rest of the world of a couple of GDP points.
Figure 13. External vulnerability in Latin America (I): stocks. Net financial investment position (% of GDP)
(b) LAS.
(c) LAN.
Notes: LAC = Latin America and the Caribbean; LAN = Costa Rica, El Salvador, Guatemala, Honduras, Mexico, Nicaragua, Panama and the Dominican Republic; LAS = Argentina, Bolivia, Brazil, Chile, Colombia, Ecuador, Peru, Uruguay and Venezuela.
Source: own research based on data in Lane and Milesi-Ferretti (2007).
There were two factors behind this improvement. On the one hand, external indebtedness levels diminished considerably in the region in 2003-08, shrinking from 38% to 21% of GDP. On the other hand, Latin American governments implemented ‘armour-plating’ against financial shocks. This kind of self-guarantee was driven by the desire to avoid exposure to sudden stop and contagion episodes such as the ones that occurred between 1997 and 2002 in a number of countries in Asia, Russia and Latin America. Privileged instruments of the self-guarantee strategy were the generation of sizeable current account surpluses and the accumulation of reserves (Ocampo, 2009). Within this framework, between 2002 and 2008, the region’s international reserves increased from 13% to 17% of GDP, despite the phenomenal growth in regional GDP.
The lower end of the panel (Figures 13b and 13c) shows that there are differences between the sub-regions we are looking at. One of the main differences is that the improvement in the net financial position was considerably greater in LAS. The LAN sub-region shows vulnerability indicators that leave it more exposed. However, it should be taken into account that the regional averages tend to conceal asymmetries. Accordingly, it must be considered that the two biggest economies in the region have somewhat higher-than-average external exposure levels. Mexico, for example, had a net debt position of 25% of GDP at the start of the crisis and Brazil was also a net debtor despite the sizeable accumulation of reserves. In both cases, much of the net debt came not from the public sector as in the crises of the 1990s, but from private sector balance sheets.
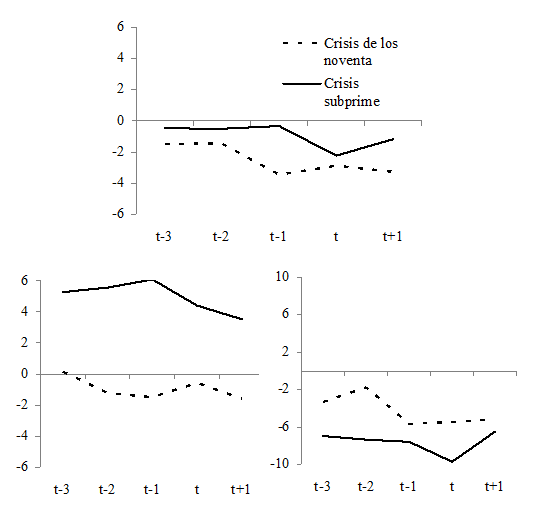
As for vulnerability indicators based on flows, the evidence regarding the trade balance shows a similar pattern to the stock of net debt: there were considerable improvements in South America, but not in the LAN region (Figure 14). For Central American countries, this is none other than the reverse side of the export anaemia and excessive reliance on remittances from the US. But it is also the case of a large economy like Mexico, whose export volume grew by a mere 3% per year during the 2003-07 boom.
In short, globally, the fragility indicators reveal that, as in the case of fiscal indicators, the region’s external vulnerability evolved positively in the period immediately before the crisis, although there are differences and they must be taken into account; while the LAN region did not achieve considerable reductions on the external front, the biggest regional powers present a somewhat more vulnerable position.
Figures 14a, 14b and 14c. External vulnerability in Latin America (II): flows. Trade balance (% of GDP)
(b) LAS.
(c) LAN.
Notes: LAC = Latin America and the Caribbean; LAN = Costa Rica, El Salvador, Guatemala, Honduras, Mexico, Nicaragua, Panama and the Dominican Republic; LAS = Argentina, Bolivia, Brazil, Chile, Colombia, Ecuador, Peru, Uruguay and Venezuela.
Source: own research based on IMF data.
Finally, we will analyse the changes in vulnerability associated with domestic financial intermediation. When evaluating this point it should be taken into account that the region’s financial systems are shallow and less developed than might be expected based on per capita GDP (Torre et al., 2007). Aside from what quantitative indicators like the M2/GDP or private lending/GDP show, there are qualitative characteristics that point to a lack of depth. An important one is the weakness of long-term lending supply and the presence of floating rates, indexation and dollarization in long-term debt markets. Another negative characteristic is that the markets are highly segmented. Only the large corporations have access to corporate bond markets or external markets, while at the same time small firms and households face a significant level of rationing.
In this context of low levels of financial development, there are a number of risk factors which the literature on financial underdevelopment brings to the fore: the spiralling growth in lending –and the fragility of balance sheets which this implies– and the level of dollarisation of the deposits –which can translate into a decoupling between non-transferable assets and liabilities in dollars–.
The vulnerability implied by an exaggerated increase in lending appears to be significant in the region. Lending as a percentage of GDP increased sharply between 2005 and 2008, and is higher than it was in previous crises. This is relevant because, as Figure 13a shows, crises systematically end up with massive financial reversals and contractions in lending.
The breakdown by regions allows us to pinpoint the greatest vulnerability: in the LAN sub-region. There, lending has expanded quickly in the last few years, led by an increase in the foreign involvement in the financial system, and when the subprime crisis came it was clearly above the levels of previous crises. In South America, meanwhile, lending expanded during that period, mainly in Brazil and Venezuela, but is in better condition than in previous crises.
Figure 15a, 15b and 15c. Financial vulnerability in Latin America (I): stocks. Lending to the private sector (% GDP)
(b) LAS.
(c) LAN.
Notes: LAC = Latin America and the Caribbean; LAN = Costa Rica, El Salvador, Guatemala, Honduras, Mexico, Nicaragua, Panama and the Dominican Republic; LAS = Argentina, Bolivia, Brazil, Chile, Colombia, Ecuador, Peru, Uruguay and Venezuela.
Source: own research based on data in Beck et al (2007) and IADB.
Naturally, since it is a region that is financially underdeveloped, lending growth must in principle be welcome. The wake-up call with regard to vulnerability comes because often swift expansions in lending are hard to combine with improvements in regulation and supervision which prevent the formation of bubbles and a sloppy allocation of credit.
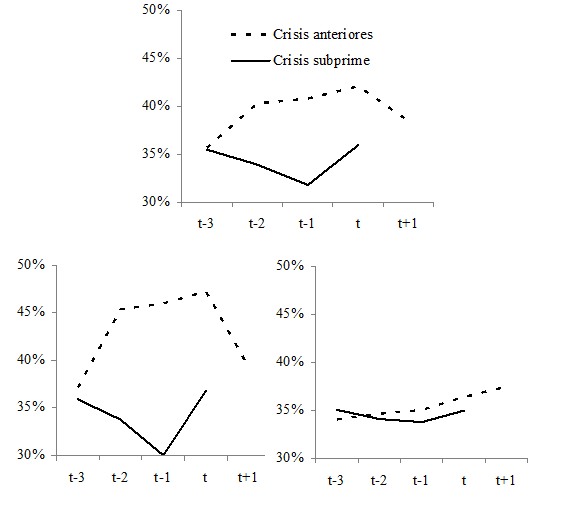
Figures 16a, 16b and 16c. Financial vulnerability in Latin America (II): lending in dollars (% of total lending)
(b) LAS.
(c) LAN.
Notes: LAC = Latin America and the Caribbean; LAN = Costa Rica, El Salvador, Guatemala, Honduras, Mexico, Nicaragua, Panama and the Dominican Republic; LAS = Argentina, Bolivia, Brazil, Chile, Colombia, Ecuador, Peru, Uruguay and Venezuela.
Lastly, with regard to dollarisation and, by extension, to decoupling risk, the evidence shows a modest but quite widespread reduction in vulnerability. The dollarisation of lending followed a downward path during the boom, going from 35% to 30% prior to the crisis. In the periods of instability of the 1990s the situation was the opposite: dollarisation increased sharply prior to the collapse.
When analysing this phenomenon in sub-regional terms, we see that although it is widespread, it is sharper in the economies of South America. In particular, in Argentina and Bolivia the reduction in financial vulnerability has been very sharp. In other countries in the region, like Uruguay and Peru, in contrast, dollarisation persists.
In short, overall, the financial fragility indicators show that there have been improvements in the last few years and this has likely helped the region avoid banking collapse phenomena or, worse still, twin crises as occurred in some countries during the 1990s.
The Scope for Political Anti-crisis Measures
As we have mentioned, as well as the size of the shock and degree of vulnerability, a crucial third factor in determining the post-shock trend is the political manoeuvring room to respond to the imbalances. Naturally, a detailed analysis of political scope amply exceeds the remit of this paper. So we will concentrate on the two policies that play a pivotal role in the anti-cyclical response: fiscal and monetary policies.
The responses were especially dynamic. Underpinned directly by short-term aggregate demand through public spending packages, tax cuts and monetary policy measures aimed at reducing the price of money were introduced, as well as allowing the exchange rate to absorb part of the adjustment and ensuring adequate liquidity provision to the financial system. As we shall see, the analysis of these policies will lead us to conclude that this time the regional authorities were able to offer a better quality response, which in all likelihood helped improve the results in terms of activity levels.
On the fiscal front, the stimulus packages implemented were of a considerable scale. As Figure 17a shows, the fiscal accounts of all the countries in the region moved towards deficit when the recession kicked in. While in 2003-08 the region averaged a primary surplus of 1.2% of GDP, 2009 closed with a deficit of 0.8% of GDP. This shift in fiscal policy was due to both the tax cuts and the higher expenditure. The sub-regional breakdown shows that there is a difference: in South American economies the movement towards deficit was somewhat sharper.
Figures 17a and 17b. The subprime crisis and fiscal policy in Latin America
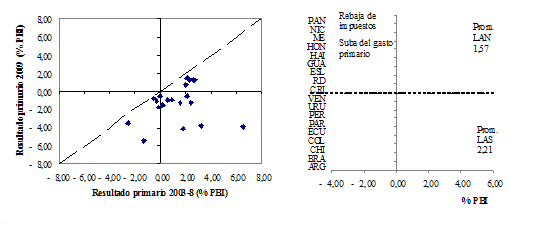
(b) Breakdown of the increase in the primary deficit.
Source: own research based on ECLAC and IADB data.
Part of the anti-cyclical drive came from automatic stabilisers. It is well known that these stabilisers act in the region mainly by tax revenues due to the small scale of the transfer systems, like unemployment insurance, in place.
Tax revenues slowed considerably during the final quarter of 2008 and the first quarter of 2009, falling from 15% growth in real terms in the first half to a 4% contraction during the crisis. In sub-regional terms, the effect was especially strong in the LAN sub-region, where real revenues shrank by more than 10% year-on-year during the recession. The sharpest differences are due to the degree of dependence on the international economy of some countries with respect to public sector revenues. Consequently, Bolivia, Mexico, Ecuador and Venezuela were especially affected by the slump in international commodities markets, while in Central American countries the main impact was due to the recessive trends linked to declines in remittances with the resulting toll on activity and tax revenue (Gómez Sabatini & Jiménez, 2009). With respect to the larger economies, the performance of automatic stabilizers has been particularly strong in Brazil, Chile and Colombia, accounting for more than half of the change in the primary deficit between 2007 and 2009 (Fiscal Monitor, 2010).
However, the starkest contrast with past experience is linked to implementation of discretionary anti-crisis fiscal policies. On the expenditure side, the stimulus plans implemented by the region focused on investment in infrastructure and public works, particularly in the case of large economies. According to ECLAC (2010), Argentina’s new spending on housing, hospitals, sewers and roads in 2009 amounted to US$15.9 billion, ie, double the amount spent in 2008. In Brazil, financing of the Growth Acceleration Program (PAC) was expanded by US$62 billion, the government ramped up public investment by US$4.5 billion and it guaranteed a somewhat larger amount of the Sovereign Fund to contain aggregate demand. In Mexico, the Programme to Promote Growth and Employment (PICE) increased infrastructure investment by 0.7%, although its effect was partially offset by cuts in other expenditure. In Chile, the 2009 budget included a substantial rise in public spending, particularly related to infrastructure, which expanded in real terms by 9% in the year.
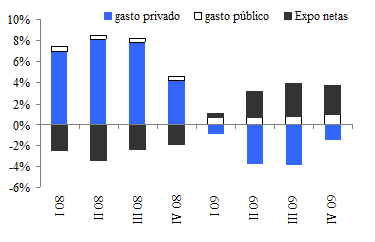
The substantial stimulus packages implemented were important to mitigate contraction of both private demand and external demand and helped to soften the contraction of economic activity. As Figure 18 shows, in the larger economies (LAC7) public expenditure’s contribution to GDP growth was positive and important during the crisis quarters. In some countries, like Uruguay, the contribution was smaller, but this was mainly because the effects of global instability on private demand were more benign.
Figure 18. The role of fiscal policy in Latin America during the crisis: contribution of aggregate demand items to GDP growth
Source: own research based on ECLAC data.
A reasonable hypothesis is that governments were able to implement anti-cyclical policies because they operated in a context where fiscal vulnerability was lower, as discussed above. Reduced vulnerability means greater fiscal room for manoeuvring, to the extent that the public debt service and better interest rates performance do not force the government to try to generate tax surpluses in the context of a recession, as happened in previous instability events.
In the field of monetary policy there were also significant changes. First, unlike past episodes, exchange systems showed greater flexibility, allowing the currency to absorb part of the external shock and to depreciate in response to the shortage of foreign currency without triggering a currency crisis (Figure 19).
Figures 19a and 19b. Exchange rate policy strategies during the crisis
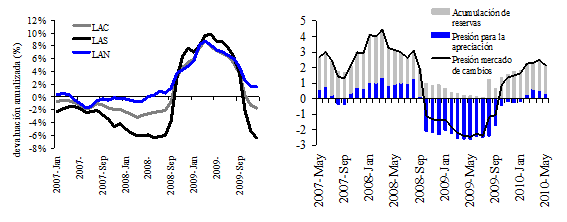
(b) Pressures on the currency exchange market.
Note: the exchange rate pressure index is the weighted sum of growth in reserves and the nominal exchange rate with the U.S. (where positive growth implies an appreciation of domestic currency). The weighting is given by the standard deviation of reserves and the inverse of the standard deviation of the exchange rate.
Source: own research based on IADB data.
To boost demand central banks cut key monetary policy interest rates (Figure 20). The effect was especially felt in economies that, through improvements in monetary policy frameworks, strove to reposition the interest rate as an effective signalling mechanism for monetary policy in the context of inflation targeting systems, such as Brazil, Chile, Mexico, Colombia and Peru.
To mitigate the effects of the reversal in flows, monetary policy sought to provide the market with liquidity in domestic currency. In general, central banks in the region increased financial aid lines to banks, while in the larger economies such as Brazil central banks were allowed to buy the portfolios of small and medium-sized banks with solvency problems. Consequently, bank lending to the private sector, which in other episodes of stress had collapsed along with activity levels, remained relatively stable during the current crisis. However, total lending rose during the crisis, and this was mainly due to the performance of public banks. In Brazil, Chile and Colombia, for example, lending from public banks grew by between 15% and 20% in 2009, while lending from private banks shrank by 3%-5%.
Figure 20. Monetary rate policy strategies during the crisis
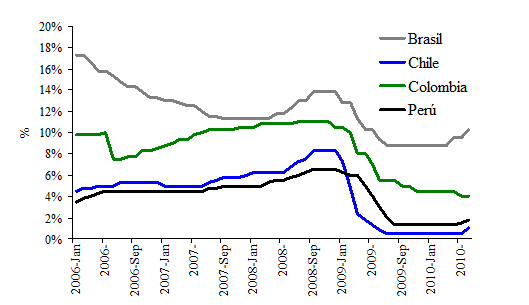
This evidence indicates that countries also have greater monetary policy scope. Furthermore, one might posit that, as in the case of fiscal policy, the greater scope for manoeuvre in monetary policy compared with the past came as a result of the lower vulnerability. Obviously, the reduction in external exposure resulting from self-guarantee strategies played a critical role on the monetary front; the region had room to deplete reserves and also were not significantly dependent on external financing to support growth.
In some countries improvements at institutional level in the context of implementing fiscal responsibility schemes combined with inflation targeting also played a prominent role. These improvements might explain the rapid reversal of the capital flight. In fact, now the problem is the opposite. In particular, in large economies the pressure in foreign exchange markets has mounted and has been absorbed essentially by the accumulation of reserves.
Concluding Remarks and Outlook
There are three points that we would like to emphasise to conclude our analysis:
- The instability episodes and shocks linked to the subprime crisis indicate that Latin America is still highly dependent on global economic performance. Although the shocks and contagion took a smaller toll on the region than in the 1980s and 1990s, the effects were still very significant.
- The emergence of China and the Asian economies is significantly changing the constraints and opportunities for the region. This is particularly true for South America, which has benefited from increased demand for its natural resources. In this new context, Latin America has the opportunity to participate in the group of emerging economies whose growth prospects are greater than those projected for the developed world. However, it is important to take into account the asymmetries and heterogeneities that exist in the region and that were identified in this work. There is even evidence that the heterogeneity of growth opportunities increases as a reflection of post-crisis adjustment, as suggested by the greater dispersion in the probability distributions of growth rates.
- There has been significant progress in reducing macroeconomic vulnerability. This is a common trend in the region and applies to the fiscal, financial and external areas. As a result, political manoeuvring room has increased and the authorities have been able to implement anti-cyclical policies in order to alleviate the impact of the crisis. In this regard, we highlight the low levels of public debt, external financial exposure and dollarization. The self-guarantee strategies implemented in response to instability in the 1990s were also very helpful. The financial front also provided strengths, with moderate growth in lending and a decrease in the dollarisation of the financial system.
Against this backdrop, it is extremely encouraging to note that towards the end of 2009 the region recovered pre-crisis activity levels even though G7 countries closed the second quarter of 2010 2.5% below those levels. But this should not lead us to overestimate the progress made in terms of macroeconomic policies or to underestimate the scale of the uncertainty that prevails in the global economy.
The challenges are considerable. The first point to stress, and one which was already looming before the crisis began, is that Latin America is not Asia. The capacity of the region’s large economies to pursue a strategy of export-led growth is severely limited by the risks of exchange rate appreciation (as in Brazil and Chile) and/or domestic inflation (as in Venezuela and Argentina) and ultimately the potential return of the Dutch disease. Central America and Mexico, meanwhile, have seen export growth slowdown. These countries are increasingly dependent on the battered US economy for their own take-off, and they also face very aggressive competition from China and other Asian countries.
In the last few years, neither the resource-rich countries of the LAS group nor the rest have shown that they have a consistent set of policies for development. The most successful post-war development strategies were based on export-led growth and it is difficult to think it will be possible to repeat these experiences as a way to generate employment in a global economy facing the threat of currency wars and protectionism.
A second challenge relates to the macroeconomic policy sphere. While it is true that this time the crisis policies played a central role and that the debt burden declined significantly, thinking that improvements in policy management are consolidated may lead to further complications in the future. In fact, the fiscal accounts in several countries in the region had moved into deficit territory even before the crisis and the need to seek funding had increased. This is the case of the two largest economies, Brazil and Mexico, but also smaller economies like the Dominican Republic and Ecuador.
Finally, there is the question of the performance of the international economy. It is important to note that the post-crisis adjustments not only are not but in many cases have just begun and it is unclear which path will be taken by the major global players on the monetary, currency and fiscal fronts. The scenarios of possible solutions to global imbalances and the clusters that exist today mean that the region is in a very different ‘world’. A very real threat facing Latin America in this scenario are the spillover effects (or externalities) caused by excess international liquidity linked to quantitative easing and other operations aimed at reviving lending in developed countries. Externalities are taking the form of a higher probability of bubble formation in the region, as well as exacerbated currency appreciation pressures with the resulting risk of the Dutch disease. The countries of the region do not have enough policy scope to bear excess liquidity of the scale we are seeing for very long. Furthermore, if this situation leads to an increase in self-guarantee strategies, this would not be functional either for Latin American growth or to solve the problems of global imbalances.
Of course, talk of externalities means referring to problems of coordination and collective action involving all global players. Hence, the countries of the region should not miss any opportunity to discuss their problems at international forums starting, naturally, with the G-20, which includes the three largest economies in the region.
Bibliography
Acharya, V.V., & P. Schnabl (2010), ‘Do Global Banks Spread Global Imbalances? Asset-Backed Commercial Paper During the Financial Crisis of 2007–09’, IMF Economic Review, vol. 58, nr 1, pp. 37-73.
Albrieu, R., & J.M. Fanelli (2009), ‘América Latina frente a la crisis internacional: el desafío de la recuperación’, Boletín Informativo Techint, August.
Bordo, M., & J. Lane (2010), ‘The Global Financial Crisis: Is it Unprecedented?’, presented at EWC/KDI Conference, Honolulu, Hawaii, 19-20/VIII/2010.
Caballero, R., E. Farhi & P.O. Gourinchas (2008), ‘Financial Crash, Commodity Prices and Global Imbalances’, CEPR Discussion Papers, nr 7064.
Calvo, G., A. Izquierdo & L.F. Mejía (2008), ‘Systemic Sudden Stops: The Relevance of Balance-Sheet Effects and Financial Integration’, RES Working Papers, nr 4581, Inter-American Development Bank, Research Department.
Canuto, O. (2010), ‘Recoupling or Switchover? Developing Countries in the Global Economy’, mimeographed, World Bank.
Cárdenas, O., & E. Levy Yeyati (2010), ‘Brookings Latin America Economic Perspectives’, mimeographed, September.
Cerra, V., & S. Saxena (2007), ‘Growth Dynamics: The Myth of Economic Recovery’, BIS Working Papers, nr 226.
Cowan, K., E. Levy Yeyati, U. Panizza & F. Sturzenegger (2006), ‘Sovereign Debt in the Americas: New Data and Stylized Facts’, RES Working Papers, nr 4480, Inter-American Development Bank, Research Department.
Díaz Alejandro, C. (1985), ‘América Latina en la depresión 1929-1939’, in Gerzovitz et al. (eds.), Teoría y Experiencia del Desarrollo Económico, FCE.
ECLAC (2008), Estudio económico de América Latina y el Caribe, 2007-2008 (LC/G.2386-P), United Nations publication, sales ref. S.08.II.G.2, Santiago de Chile.
ECLAC (2010a), ‘Panorama de la inserción internacional de las economías de América Latina y el Caribe’, mimeographed.
ECLAC (2010b), ‘La reacción de los gobiernos de las Américas frente a la crisis internacional: una presentación sintética de las medidas de política anunciadas hasta el 31 de diciembre de 2009’, mimeographed.
ECLAC and ILO (2010), ‘Crisis, estabilización y reactivación: el desempeño del mercado laboral en 2009’, Boletín Coyuntura laboral en América Latina y el Caribe, June.
Edwards, S. (2007), ‘Crises and Growth: A Latin American Perspective’, Working Papers in Economic History, nr 07-07, Universidad Carlos III, Departamento de Historia Económica e Instituciones.
Fahri, M., & R. Zanchetta (2009), ‘Derivatives Operations of Corporations from Emerging Economies in the Recent Cycle’, mimeographed, UNICAMP.
Gómez Sabatini, C., & J.P. Jiménez (2009), ‘El papel de la política tributaria frente a la crisis: límites y posibilidades’, mimeographed, ECLAC.
IADB (2009), ‘Dilemas de política para tiempos sin precedentes: cómo enfrentar la crisis global en América Latina y el Caribe’, mimeographed, IADB.
IMF (2009), ‘Global Financial Stability Report’, mimeographed, April.
IMF (2010a), ‘World Economic Outlook’, mimeographed, October.
IMF (2010b), ‘Regional Economic Outlook: Western Hemisphere’, October.
IMF (2010c), ‘Fiscal Monitor’, May.
Izquierdo, A., R. Romero & E. Talvi (2008), ‘Booms and Busts in Latin America: The Role of External Factors’, IADB RES working paper, p. 4569.
Jara, A., R. Moreno & C. Tovar (2009), ‘The Global Crisis and Latin America: Financial Impact and Policy Responses’, BIS Quarterly Review, June.
Kacef, O. (2010), ‘América Latina frente a la crisis internacional: ¿por qué esta vez fue diferente?’, Pensamiento Iberoamericano, nr 6.
Lane, P., & G.M. Milesi-Ferretti (2007), ‘The External Wealth of Nations Mark II: Revised and Extended Estimates of Foreign Assets and Liabilities, 1970–2004’, Journal of International Economics, nr 73, November, pp. 223-250.
Levy Yeyati, E. (2010), ‘Emerging Economies in the 2000s: Real Decoupling and Financial Recoupling’, mimeographed, UTDT.
Ocampo, José (2007), ‘La macroeconomía de la bonanza económica latinoamericana’, Revista CEPAL, nr 93, December, pp. 7-29.
Ratha, D., & W. Shaw (2007), ‘South-South Migration and Remittances’, World Bank Working Paper, nr 102, World Bank, Washington DC.
Reinhart, C., & V. Reinhart (2010), ‘After the Fall’, presented at the Federal Reserve Bank of Kansas City Economic Policy Symposium, Macroeconomic Policy: Post-Crisis and Risks Ahead, Jackson Hole, Wyoming.
Rosales, O. (2010), ‘El dinamismo de China y Asia emergente: oportunidades y desafíos para América Latina y el Caribe’, Pensamiento Iberoamericano, nr 6.
Swiston, A.J. (2010), ‘Spillovers to Central America in Light of the Crisis: What a Difference a Year Makes’, IMF Working Paper, nr 10/35.
Torre, A. de la, J. Gozzi & S. Schmukler (2007), ‘Capital Market Development: Whither Latin America?’, World Bank Policy Research Working Paper Series, nr 4156.

