Today, we are launching a new edition of the Elcano Global Presence Index; an index that aims to measure the extent of the external projection of countries.
These are the data for 2018, that complement a series that now includes 57,672 observations across 13 years (since the fall of the Berlin Wall) for 120 countries (10 more than last year) that account for 99.3% of world GDP and 94.3% of world population.
New countries included in the Index are Bahamas, Burkina Faso, Gabon, Equatorial Guinea, Jamaica, Mali, Mauritius, Mozambique, Namibia and Nicaragua. By adding Latin American and African countries, these regions representativeness in the project goes up to 99.5% of regional GDP and 97.5% population in the case of Latin America and to 86.7% and 78.1%, respectively, for Sub-Saharan Africa. This reinforces the potential of this tool for exploring contemporary international relations where the Global South plays a stronger role.
For several years, the launching of a new edition came in hand with a yearly report, analysing the main results of the new edition (which countries go up, which countries go down) and an update of global trends since the end of the Cold War (is the world globalizing, de-globalizing?). However, following very wise recommendations and suggestions by our friends at the Competence Centre on Composite Indicators and Scoreboards (COIN) from the Join Research Centre in Ispra, this year, we will skip the annual report. We will rather focus on a new sub-product (the geographical breakdown of the EU global presence –you will read more on this later this year).
Despite this decision, new global presence results for 2018 are so interesting that we could not help ourselves and had to go for this short piece, showing just a couple of ideas that new data are telling us: top 15 countries are the same as last year (but in different positions) and the globalization process is back on track.
Top 15: the devil is in the details
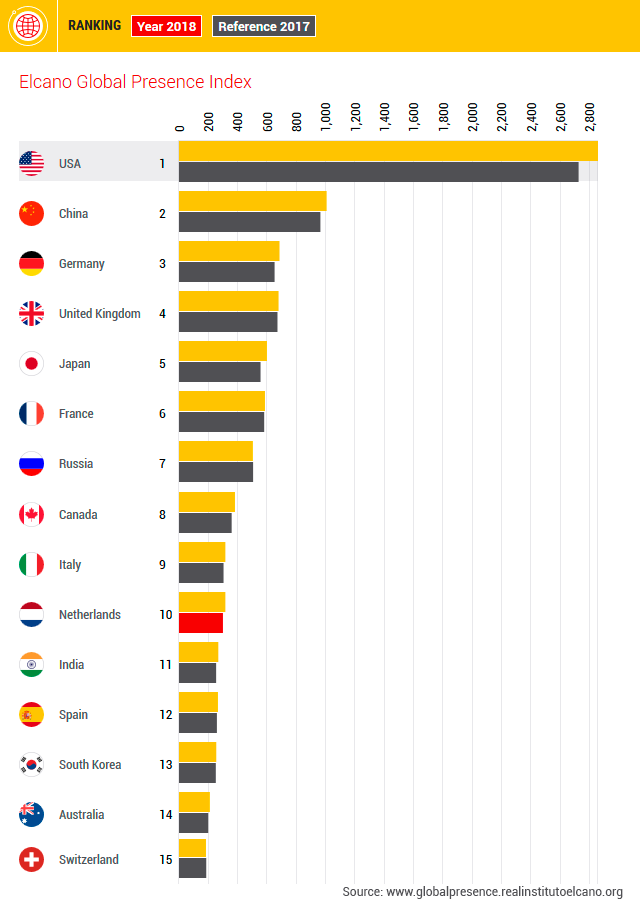
In 2018, the 15 countries in the top positions of the Elcano Global Presence ranking are the same as in 2017.
However, there are three interesting sorpassos. Germany and the UK swap positions: the UK falls to the 4th position while Germany climbs to the 3rd (a Brexit effect?). The same happens with Japan, that goes up to the 5th position while France falls 6th (Abenomics?) and with India (now 11th) and Spain (12th). We were actually expecting India to surpass Spain at some point. This other Asian giant is the second most populated country in the world and, although it has opted for a more inward-oriented development model (when compared to China), its demographic size and economic and military potential had to show, at a certain point, in its external projection.

Globalization is back
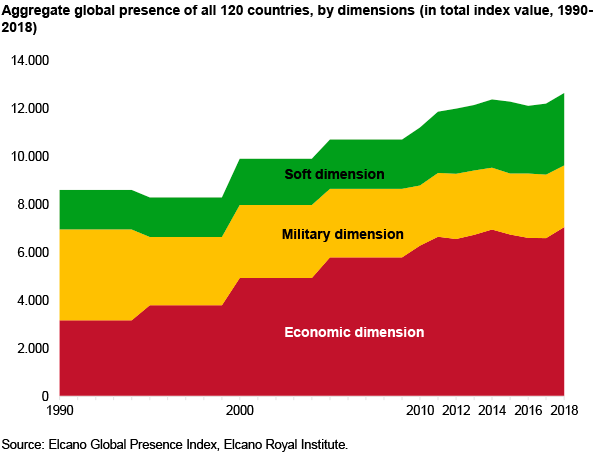
As explained elsewhere, the sum of the global presence values of all 120 countries and its evolution can serve as a proxy for tracking the globalization process.
After years of slow or stagnating globalization or, even, de-globalization, we are now back to a relatively dynamic globalization process. Added global presence had decreased in 2015 and 2016, after two periods of fast (1990-2011) and slow globalization (2012-2014). However, it recorded a mild increase of 0.7% in 2017 and a substantially higher growth of 3.7% in 2018 (the highest record since 2011).
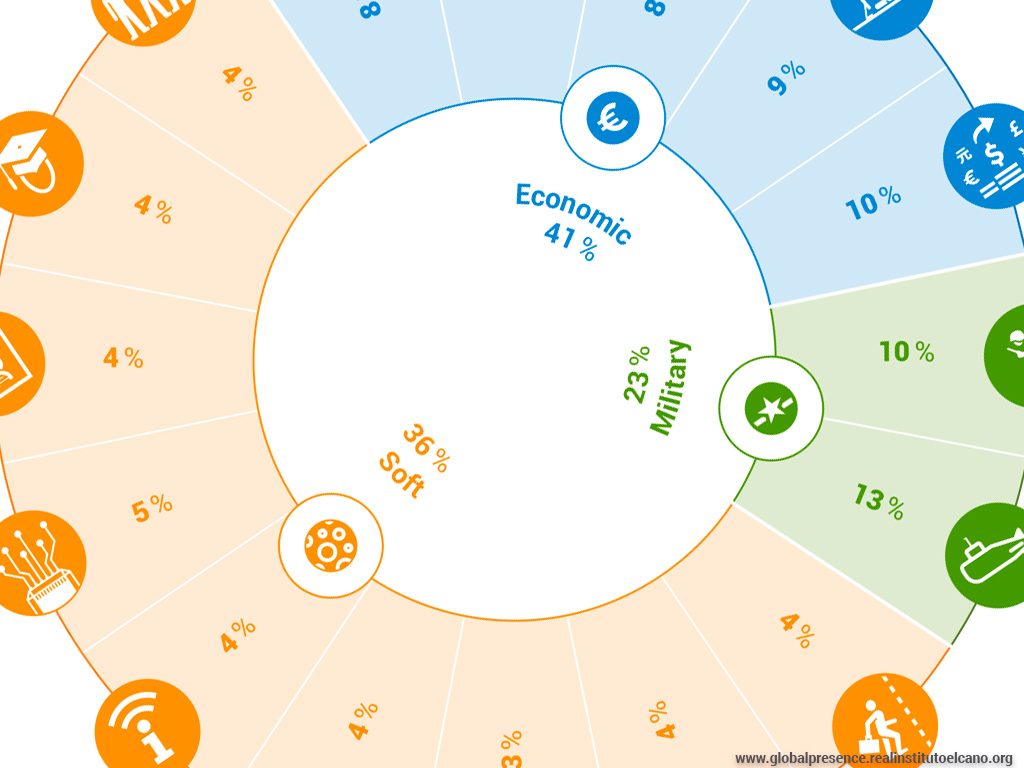
Moreover, this new globalization phase comes in a slightly new form. On the one hand, it is the result of a very dynamic economic presence (+ 4.8% in 2018) and a retrenching military dimension (- 4.5% this same year); two features that also characterizes the fast globalization period. On the other hand, however, it also shows an extremely dynamic soft dimension (+ 10.7%), unlike in the 2000s. It should be noted that this was the only resilient dimension during the de-globalization phase.

Methodological fine tuning
With each new edition, we also apply methodological improvements to the Index. In this last edition, there are two main modifications.
Firstly, we have the updated of the weighting coefficients of the different indicators. As explained in this publication, we periodically conduct a survey to experts in international relations of think tanks worldwide. These assessments are the basis for the aggregation of the index indicators. By adding different surveys, applied in different moments in time and to experts worldwide, both time and geographical biases influencing the answers are nuanced.
Secondly, also following COIN’s recommendations, we have improved our Sports indicator. Traditionally this indicator was divided into two sub-indicators, one dedicated to the performance of each country in the Olympic Games and another dedicated to the performance of the absolute national football teams (points in FIFA classification). However, recurrently we were told about the significant weight that football clubs had acquired in the external projection of countries. For this reason, to that measurement based on the classification of FIFA, we have incorporated the data offered by the International Federation of Football History and Statistics (IFFHS) on the performance of football clubs. This institution offers the annual classification of more than 400 clubs belonging to the different regional confederations (UEFA, CONMEBOL, AFC, CAF, CONCACAF). In this way, we add that score according to the country of belonging of each club, and then this variable is incorporated to the calculation of the presence of each country in the Sports indicators, thus including the effect of the football clubs on the external soft projections of the countries which belong to.

Stay tuned for the upcoming geographical breakdown of the EU global presence and, meanwhile, explore and enjoy our new 2018 edition at the Global Presence’s website.


