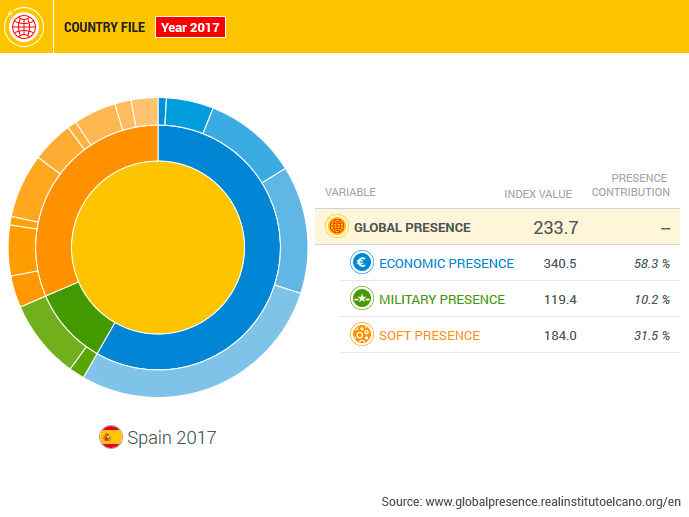
Spain was ranked 11th out of 110 countries in the 2017 Elcano Global Presence Index, which measures the results of internationalisation, up from 12th in 2016 (see Figure 1).
| Country | Score | Country | Score |
|---|---|---|---|
| 1. United States | 2,494.1 | 11. Spain | 233.7 |
| 2. China | 840.7 | 12. South Korea | 225.8 |
| 3.United Kingdom | 636.7 | 13.India | 202.4 |
| 4. Germany | 618.5 | 14. Switzerland | 190.4 |
| 5. France | 531.6 | 15. Australia | 185.5 |
| 6. Japan | 518.1 | 16. Belgium | 185.5 |
| 7. Russia | 380.3 | 17. Singapore | 127.7 |
| 8. Canada | 337.4 | 18. Sweden | 126.4 |
| 9. Netherlands | 297.3 | 19. Brazil | 118.9 |
| 10. Italy | 271.1 | 20. Saudi Arabia | 113.3 |
The index, the result of adding together 16 indicators of external projection which are aggregated according to the criteria of experts in international relations, measures the ability of countries to project themselves beyond their borders and the extent to which they are participating in and shaping the process of globalisation.
It measures global presence based on three dimensions. First, it ranks a country’s economic presence, including outward foreign direct investment and other elements such as energy, services and exports. Second, it assesses a country’s military presence, which is determined by the number of troops deployed abroad and the equipment available for deployment, Third, it includes statistics on a country’s soft presence, which is based on a wide number of factors including exports of cultural products, tourist arrivals and official development aid.
The index does not measure power nor does it reflect the effort of countries to achieve greater internationalisation or the openness of countries. Instead it shows the results of internationalisation and examines the external projection of countries more than the way in which they absorb the external action of other countries within their national territory. The index thus takes into account the exports of manufactured goods, for example, but disregards the imports. By comparing a state’s presence with its actual power (or influence), it is possible to gauge the extent to which it is punching above or below its weight. Spain is regarded as pinching below its weight.
Spain’s economic presence (58.3% of its total global presence) was unchanged over 2016, while its military presence (10.2%) was slightly lower and its soft presence (31.5%) a tad higher (see Figure 2). Spain was ranked 12th in economic presence, 17th in military presence and 9th in the soft dimension.
| Variable | 1990 | 1995 | 2000 | 2010 | 2013 | 2014 | 2016 | 2017 |
|---|---|---|---|---|---|---|---|---|
| Economic presence | 50.8 | 64.9 | 101.1 | 174.3 | 152.6 | 143.4 | 132.0 | 136.2 |
| % of global presence | 47.5 | 50.1 | 57.1 | 62.0 | 61.3 | 59.6 | 58.2 | 58.3 |
| Energy | 1.7 | 0.7 | 1.8 | 2.4 | 4.0 | 4.0 | 2.6 | 2.1 |
| Primary goods | 5.0 | 8.3 | 8.6 | 10.9 | 12.1 | 12.2 | 11.5 | 11.9 |
| Manufactures | 15.4 | 20.0 | 23.3 | 24.0 | 22.6 | 24.5 | 23.6 | 23.8 |
| Services | 22.3 | 24.8 | 30.1 | 35.9 | 31.4 | 31.5 | 30.4 | 32.2 |
| Investments | 6.3 | 11.0 | 37.4 | 101.0 | 82.5 | 71.2 | 63.9 | 66.2 |
| Military presence | 32.6 | 33.7 | 34.7 | 39.4 | 39.1 | 24.2 | 24.1 | 23.9 |
| % of global presence | 30.5 | 26.0 | 19.6 | 13.9 | 15.0 | 10.0 | 10.6 | 10.2 |
| Troops | 0.3 | 6.5 | 10.9 | 9.8 | 9.3 | 3.2 | 4.0 | 3.9 |
| Military equipment | 32.3 | 27.2 | 23.8 | 29.6 | 29.9 | 21.0 | 20.1 | 20.0 |
| Soft presence | 23.5 | 31.1 | 41.1 | 70.7 | 69.3 | 73.1 | 70.7 | 73.6 |
| % of global presence | 22.0 | 23.9 | 23.2 | 24.9 | 26.5 | 30.4 | 31.2 | 31.5 |
| Migrations | 1.5 | 1.8 | 2.7 | 9.2 | 8.9 | 8.8 | 8.0 | 8.0 |
| Tourism | 8.8 | 7.2 | 9.5 | 9.6 | 10.2 | 10.6 | 11.7 | 12.8 |
| Sports | 0.7 | 2.1 | 1.0 | 2.7 | 2.5 | 2.4 | 2.3 | 2.1 |
| Culture | 4.4 | 9.1 | 14.0 | 15.7 | 16.9 | 16.7 | 16.4 | 16.2 |
| Information | 0.0 | 0.1 | 0.4 | 3.7 | 7.8 | 10.9 | 10.6 | 10.5 |
| Technology | 2.7 | 2.2 | 2.5 | 4.1 | 3.2 | 2.9 | 2.4 | 2.3 |
| Science | 2.3 | 3.9 | 5.1 | 11.0 | 12.3 | 12.6 | 12.5 | 10.7 |
| Education | 1.0 | 2.0 | 3.6 | 3.8 | 4.3 | 4.3 | 4.2 | 4.1 |
| Development cooperation | 1.9 | 2.6 | 2.4 | 10.9 | 3.2 | 3.8 | 2.6 | 6.7 |
| Global presence index value | 106.9 | 129.7 | 176.8 | 284.3 | 261.0 | 240.6 | 226.8 | 233.7 |
| Position in the index | 12 | 11 | 11 | 11 | 11 | 11 | 12 | 11 |
| % share of presence | ||||||||
| Economic | 1.43 | 1.71 | 1.96 | 2.77 | 2.35 | 2.12 | 2.02 | 2.11 |
| Military | 1.08 | 1.41 | 1.37 | 1.98 | 1.74 | 1.20 | 1.14 | 1.24 |
| Soft | 1.45 | 1.77 | 2.01 | 2.84 | 2.47 | 2.41 | 2.26 | 2.31 |
| Global | 1.43 | 1.71 | 1.96 | 2.77 | 2.35 | 2.12 | 2.02 | 2.11 |
The soft presence has risen virtually every year since 2010, as a result of the increased contributions of culture, tourism and migration. This presence has weathered the country’s economic crisis (GDP shrank 9.2% between 2008 and 2013, and the pre-crisis level was not recovered until 2017) better than the economic dimension. The contribution of the soft dimension to Spain’s global presence rose from 24.9% in 2010 to 31.5% last year.
Close to 60% of Spain’s presence in the Elcano European Presence Index, which ranks the country 7th out of the 28 EU nations, is due to its soft dimension. The country received close to 82 million tourists in 2017, the second largest number in the world, and at the beginning of this year the number of foreigners in Spain stood at 4.7 million.
The economic dimension’s contribution to the global presence dropped from 62% in 2010 to 58.3%, largely due to the fall in the stock of outward direct investment from $653.2 billion to $597.2 billion in 2017, according to UNCTAD. The surge in exports of goods –from €186.8 billion to €277.1 billion over the same period– was not sufficient to offset the decline in investment abroad and maintain the contribution of the economic dimension.
The military’s share dropped from 13.9% to 10.2%, reflecting, among other things, the decommissioning of the Príncipe de Asturias aircraft carrier in 2013.
Europe, as one would expect, dominates the international distribution of Spain’s global presence. Its top 15 presence destinations in 2016, according to a prior report by Elcano, were the UK (13.5%, around the same proportion as all of Latin America), France (7.5%), the US (7.3%), Germany (7.1%), Italy (4.1%), Turkey (4%), Portugal (3.7%), Brazil (2.9%), Mexico (2.8%), China (2.4%), Belgium (1.8%), Venezuela (1.5%), Chile (1.4%), Morocco (1%) and Canada (1%)1. The relative importance of Latin America can be seen from the fact that Spain exports more to Portugal than to Latin America (7.5% of total exports vs. 5.6%).
Spain’s global index value doubled between 1990 and 2017, underscoring the extent to which the country has reasserted itself into the international community since the transition to democracy from the Franco dictatorship (1939-75), a process that coincided with globalization. Spain joined NATO in 1982, the European Union in 1986 and the euro zone in 1999.
The country’s share of the global presence index rose from 1.4% to 2.1% between 1990 and 2017, while Germany’s dropped from 6.4% to 5.6%, France’s from 6.6% to 4.8% and Italy’s from 3.2% to 2.4%, not much higher than Spain and something that few would have thought possible 40 years ago. Furthermore, Spain’s per capita income on a purchasing power parity basis (used to compare income levels in different countries) overtook Italy’s last year.
1 The 2017 figures by countries will not be published until later this year and will be very much in line with those of 2016.


