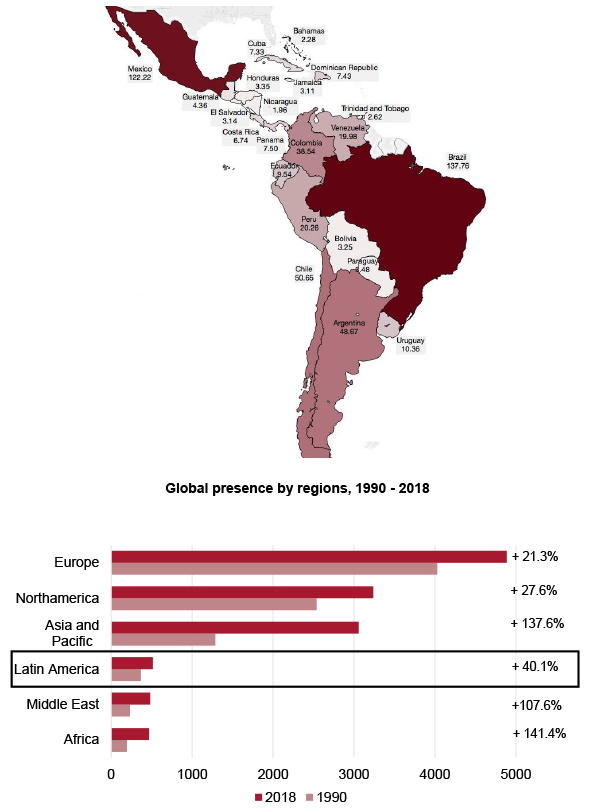
The Elcano Global Presence Index includes 22 Latin American countries (99.5% of the region’s GDP and 97.5% of its population). The region ranks fourth in the global presence ranking. However, the gaps with the Middle East and Africa are narrowing. It is the region with the lowest global presence growth rate since 1990 and the only one that loses external projection (in absolute terms) since 2012. Brazil and Mexico dispute the first position and concentrate 51% of the region’s external projection.
Global presence resilience on soft grounds
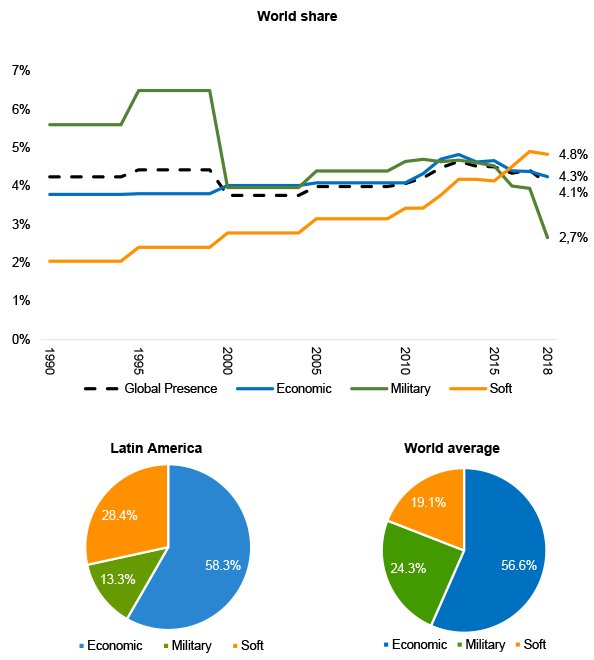
The contribution of different dimensions[1] to Latin America’s global presence is very much in line with the world average, although with a stronger soft contribution and a lower military basis. Latin America has managed to maintain its global presence world quota[2] as a result of an increasing soft projection and despite decreasing economic and military presence.
Are translatinas the response to commodity-dependent economies?
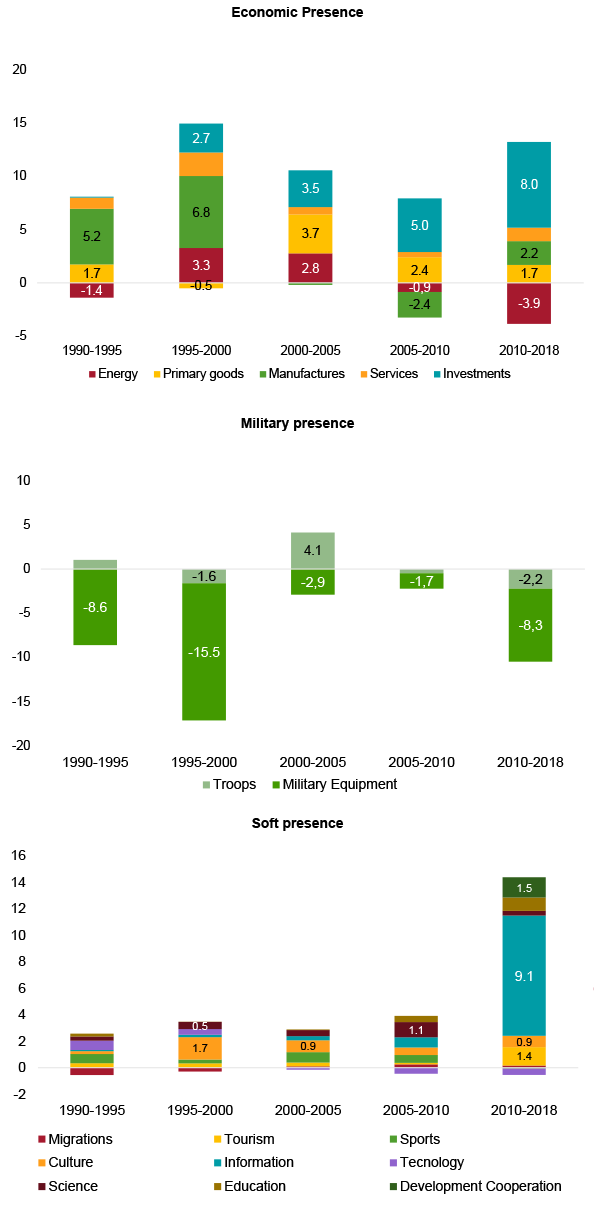
Increasingly, manufactures (Mexico-NAFTA effect) and investment drive the growth[3] of the economic dimension, somehow crowding out the energy and primary goods effect. The development of internet drives growth in the soft dimension. The reduction of military equipment explains the negative contribution of the military dimension to the global presence of Latin America.
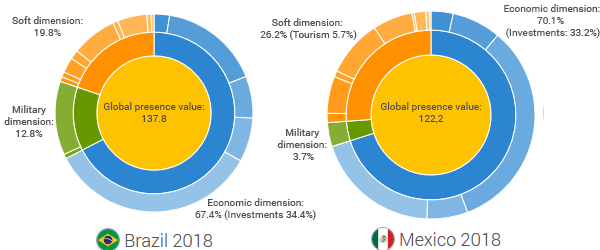
Brazil and Mexico, regional leaders
Most Latin American countries lose ranking positions. Only Brazil remains in the top 20 and only Mexico, Colombia and Panama upscale positions since 1990.
Ranking of the countries in the region (variation 1990 – 2018)
| World ranking position | Var. 1990-2018 | |
|---|---|---|
| Brazil | 18 | -3 |
| Mexico | 24 | +6 |
| Chile | 37 | -2 |
| Argentina | 40 | -17 |
| Colombia | 46 | +5 |
| Peruú | 61 | -33 |
| Venezuela | 62 | -20 |
| Uruguay | 77 | -10 |
| Ecuador | 78 | -12 |
| Panama | 88 | +2 |
| Dominican Republic | 89 | -11 |
| Cuba | 90 | -30 |
| Costa Rica | 93 | -19 |
| Guatemala | 100 | -13 |
| Paraguay | 104 | -16 |
| Honduras | 105 | -13 |
| Bolivia | 106 | -4 |
| El Salvador | 107 | -6 |
| Jamaica | 108 | -29 |
| Trinidad and Tobago | 110 | -24 |
| Bahamas | 112 | -16 |
| Nicaragua | 115 | -8 |
Source: Elcano Global Presence Index, Elcano Royal Institute
Mexico’s global presence is strongly grounded on the economic dimension and, specifically, on manufactures. Brazil has the highest record of the region in foreign investment and in military presence.
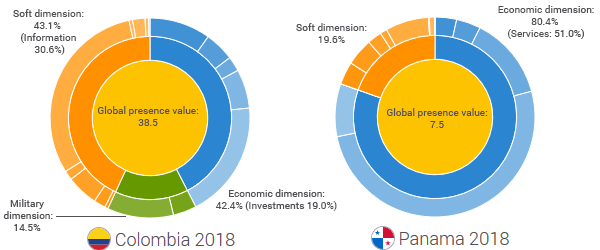
Panama and Colombia, silent drivers?
Colombia’s external projection is driven by the soft dimension, and especially the information indicator –not only due to the development of the internet but also to its high presence in the media.
Panama’s global presence is essentially economic and linked to the export of services –in line with the importance of the financial sector and the canal of Panama.
[1] The presence contributions are the magnitude that each dimension or indicator represent in the global value of a country’s presence, expressed as a percentage of a country’s total global presence.
[2] The share or quota of presence represents the weight of a country’s presence record –global or by dimensions– over the added record of all countries.
[3] This driver value shows the real contribution of each variable to global presence growth, calculated by multiplying the growth of each individual variable by its weight over total global presence in the previous year.