It is often assumed that it is a good thing for countries to be ranked in the top positions of Elcano Global Presence Index; that is, to be highly present, globally.
However, we think otherwise (this is neither a good, nor a bad thing) and always insist on two features of the Index explain why.
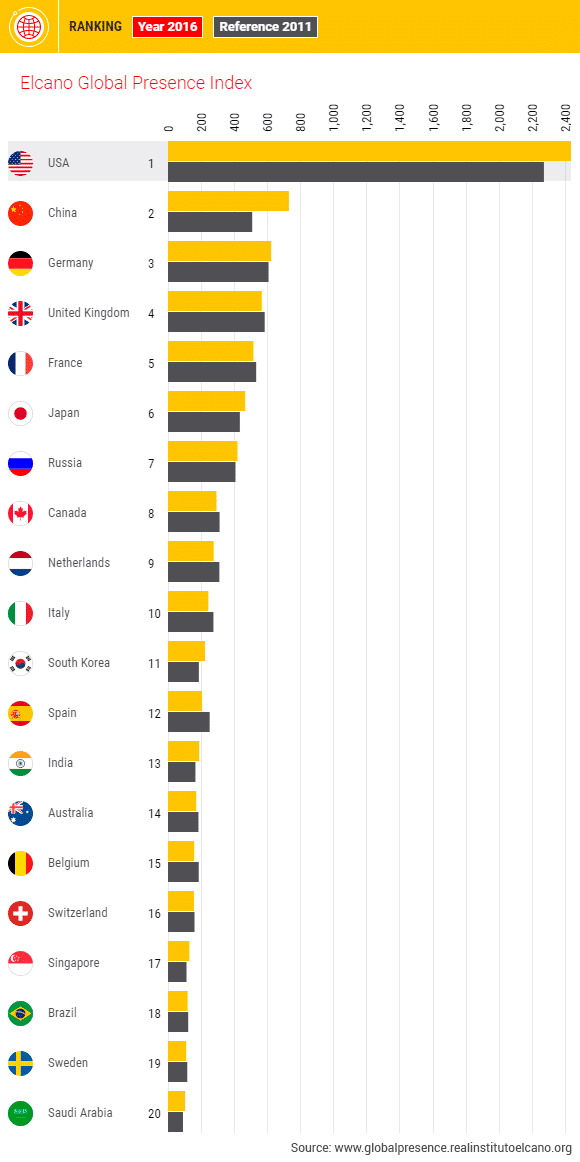
Firstly, the results of the Index strongly correlate with the economic and/or demographic size of the country (no wonder, the United States tops the ranking, followed by China). That is, for most countries and to a great extent, having a strong or a weak projection is the result of historically cumulated (and inherited) economic, social, political or cultural features. Therefore, a strong position in the ranking does not mean necessarily that the country is ‘doing well’ or that the current Administration can be congratulated (or blamed) for the country’s performance in the Index. For instance, given its small economic and demographic size, and despite its relatively high external projection, a country such as Singapore will probably never upscale to the top 10 of the ranking (it currently holds the 17th position).
Secondly, the elements of global presence (the three economic, military and soft dimensions as well as the variables that compose them) could be assessed as ‘good’ or ‘bad’ forms of external projection, depending on one’s point of view. For instance, if one country decides unilaterally and against the opinion of the international community to invade a neighbour, it will have its global presence increased. A higher number of troops deployed internationally means an increase in the military dimension and, therefore, in the final result of the Index. This could be assessed as a bad form of presence from a given perspective. Maybe, from that same perspective, most increases in the variable of development cooperation could be deemed as good as well as higher records in the technology variable (that takes into account patents applications). However, we would probably not reach a consensus on which forms of global presence are positive and which are negative. From a Realist point of view, such military external projection could be judged as a sensible and/or necessary decision in order to guarantee the security or economic interests of the invading country.
In short, the Elcano Global Presence Index is not normative. We are not encouraging countries to upscale positions. Rather, we aim at showing the objective and effective presence of countries in the global arena so that the volume and nature of this presence can be a platform for exerting power (a judgment that can be made when comparing our results with those of an index of power), or for moulding the globalization process. Also, when compared with the means of international relations, the Index can gives us a measure of the efficiency of countries’ foreign policy.
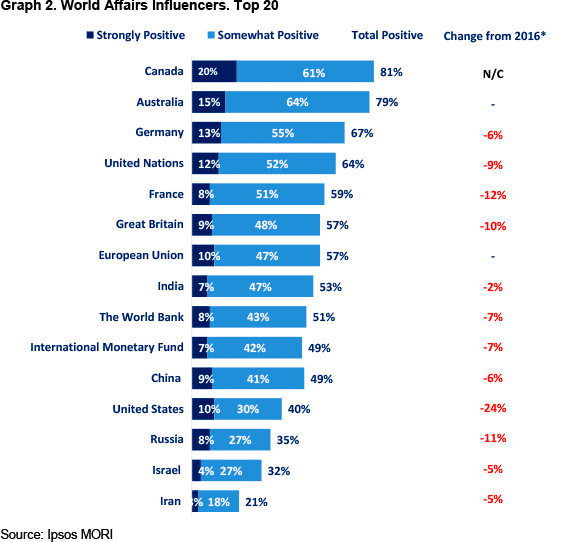
However, the question on whether this presence is good or bad is a relevant one. And, maybe, it could be answered if we compare countries’ positions ranked by global presence (Graph 1) with the results of Ipsos MORI’s poll on world affairs influencers (Graph 2). Respondents of this poll were asked which countries and organizations have the most positive influence on world affairs. It could be argued that in order to influence positively, countries need to influence in the first place and, for this task, they need to be present in the global arena. This is the reason why most influencers rank highly in global presence: they are all positioned in the top 15 of the ranking with the two exceptions of Israel and Iran.


Table 1. Global presence vs. world influence countries’ positions
| World Influence country position | Global presence country position | Difference | |
| Canada | 1 | 8 | +7 |
| Australia | 2 | 14 | +12 |
| Germany | 3 | 3 | = |
| France | 4 | 5 | +1 |
| United Kingdom | 5 | 4 | -1 |
| India | 6 | 13 | +7 |
| China | 7 | 2 | -5 |
| United States | 8 | 1 | -6 |
| Russia | 9 | 7 | -2 |
| Israel | 10 | 40 | +30 |
| Iran | 11 | 45 | +34 |
Some countries are more present than good influencers so, maybe, it could be argued, their presence is not perceived as positive. This is the case of the United States, China, Russia and, to a lesser extent, the United Kingdom. On the other hand, Australia, Canada, India and France are very good influencers relatively to their amount of global presence (Table 1).
Why is this so?
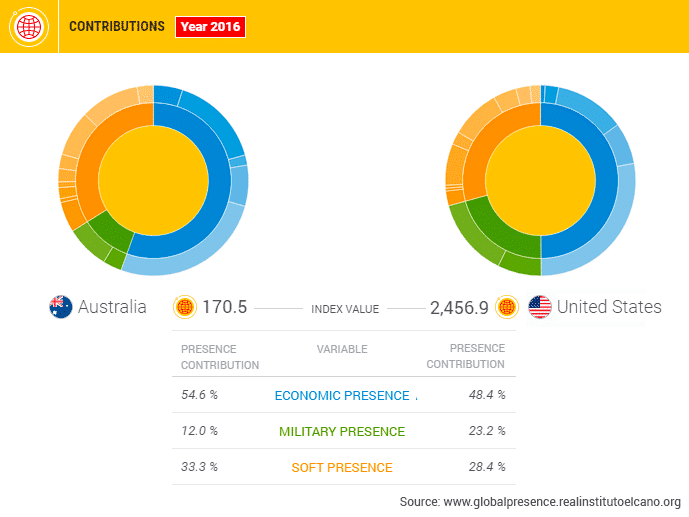
Maybe the answer partially lies in the type of global presence exerted by different countries. If we compare the country that upscales the highest number of positions in positive world influence with respect its position in global presence (Australia, 12 positions up) with the one that downscales the most (the United States, 6 down), we find the following results (Graph 3).

Firstly, military presence contributes more to the United States’ external projection than to that of Australia. In the soft dimension, Australia records higher contributions of the variables of development cooperation, science, migration, tourism, sports and education than the United States. All this might fit in the vision that peaceful forms of knowledge intensive and collaborative interactions are preferable to more conflictive ones. However, some other features of those same two countries would lead to the opposite conclusion. Technology and culture contribute substantially more to the United States’ global presence than to that of Australia.
Obviously, we cannot extract general conclusions from this anecdotal comparison. However, this simple comparative exercise shows us that labelling positive and negative forms of global presence is a very difficult task.


