Building a composite indicator is not an easy task.
Firstly, it is necessary to have a clear idea of the object or concept to be measured. This precision is mandatory for guaranteeing the coherence of the index when selecting the variables and indicators that will integrate it. Moreover, these indicators will need to be available on a regular basis, for the very wide majority of the items observed (countries, cities…) and for the time frame to be explored.
Secondly, once the first step yields the expected results, they will require a precise and clear communication, so that the targeted public can understand both the results and the tool (including its potential and, most important, its limitations).
The Elcano Royal Institute started working on the Elcano Global Presence Index in 2008. This process started with several experts meetings –experts in international relations and world economy, defence and security issues, global culture…– and it took us almost three years to come to a first version of the Index, that was published in 2011. Three years of experts’ debate might back both the concept of global presence –to what extent countries are out there– and its parts –the economic, the military and the soft dimension–. However, this academic soundness is not enough. The Index is simultaneously a conceptual and a statistical construct and, therefore, needs to be equally robust from a statistical point of view.
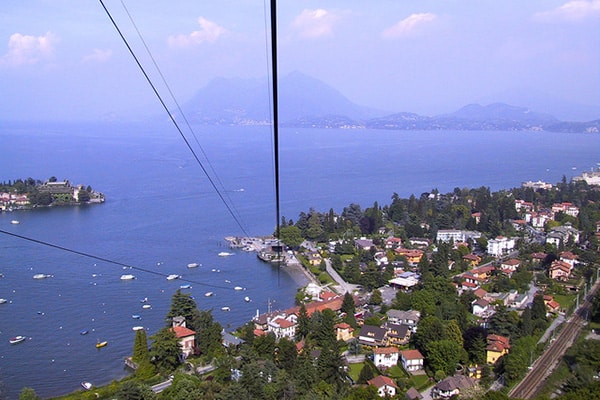
The Competence Centre on Composite Indicators and Scoreboards is part of the Joint Research Centre (JRC) in Ispra (Italy); the European Commission’s science and knowledge service devoted, in their own words, to do ‘science for policy’. JRC-COIN conducts a number of tasks. Not only they assess the European Commission on how to build or improve EUs composite indices (such as the European Innovation Scoreboard), they also build their own proposals (such as the Cultural and Creative Cities Monitor).
Beyond supporting EU’s work on composite indicators or providing their own, the JRC-COIN also shares the teams knowledge with a larger community. For instance, they published, together with the OECD the ‘Handbook on Constructing Composite Indicators: Methodology and User Guide’ –the bible in this field–. Also, they provide support to other institutions, in designing, improving or updating composite indicators. This has been the case of the Environmental Performance Index (Yale University, Columbia University), the Global Innovation Index (INSEAD & World Intellectual Property Organisation), the Global Competitiveness Index (World Economic Forum), or the Corruption Perceptions Index (Transparency International). And this has also been the case of our Elcano Global Presence Index that has gone through two rounds of evaluations with the COIN team.
Three years ago, we contacted the COIN team. Our Index was by that time at its fifth edition. In general terms, results were intuitive and seemed sound. However, we had several methodological concerns (that were usually arising in debates and presentations of the Index) that we did not know how to address. We asked for COIN’s help and a few months later we were engaged in a lively conversation with our friend Marcos Domínguez-Torreiro, going back and forth, and testing different options for solving the statistical flaws. This first phase of statistical evaluation led to a series of methodological changes (described in the 2017 report) that applied since last year’s edition.
This was followed, past November, by a gathering of the ‘community of practice’ organized by the COIN team at Ispra. It was a unique opportunity for meeting with a bunch of coordinators of indices on most varied topics –ranging from global innovation to gender inequality–, analysts that had also suffered (like us) the anxiety of coping simultaneously with conceptual, statistical and communication challenges. Thrilled with this experience (we were not alone!), we plunged into the following phase that consisted in a COIN open day.
The COIN open day on Elcano Global Presence Index was some sort of intense therapy. We spent one day with the COIN team including their head, Michaela Saisana, and almost 20 statisticians devoted entirely to the Index for a whole working day. We went through and re-assessed every bit of the Index –the concept itself, its added value, the methodology, the results, the impact of the previous statistical adjustments, its products, the communication strategy and even the website–. After that intensive day, on our own, over diner (and Italian wine, too) we took the opportunity to recap the whole process. We concluded that it had been a fruitful process for the Index but especially for us. We have learned a lot, obviously. However, there are at least three things that we thought we would never learn from a statistician (or from a group of statisticians).
1. It’s the concept, stupid! (not the maths).
Composite indicators need to make sense statistically, naturally. However, they must make sense especially from a conceptual point of view. In the event of a crossroads, indices coordinators will have to commit, and the conceptual soundness will eventually need to prevail.
2. Dare.
Do everything you think you may do with your index if you think this helps explaining some facet of reality (international relations, in our case). As for global presence, break it down geographically (by origin, by destination), into sectors (by variables, by dimensions), add it up (in regions, globally). Statistical assessments will come later.
3. Take your time to think, analyse, and communicate
Indices projects need a clear annual programme. Data will be released the same month every year, analyses need to have a predictable frequency… A series of rituals need to be scheduled so that a (hopefully) growing community receive timely information on the Index. However, do not get trapped in your own, self-imposed, rules. A 30 minutes meeting with a key policy maker can have twice the impact of a thoughtful report.
Well, after all, at Ispra they do ‘science for policy’.


