

Theme
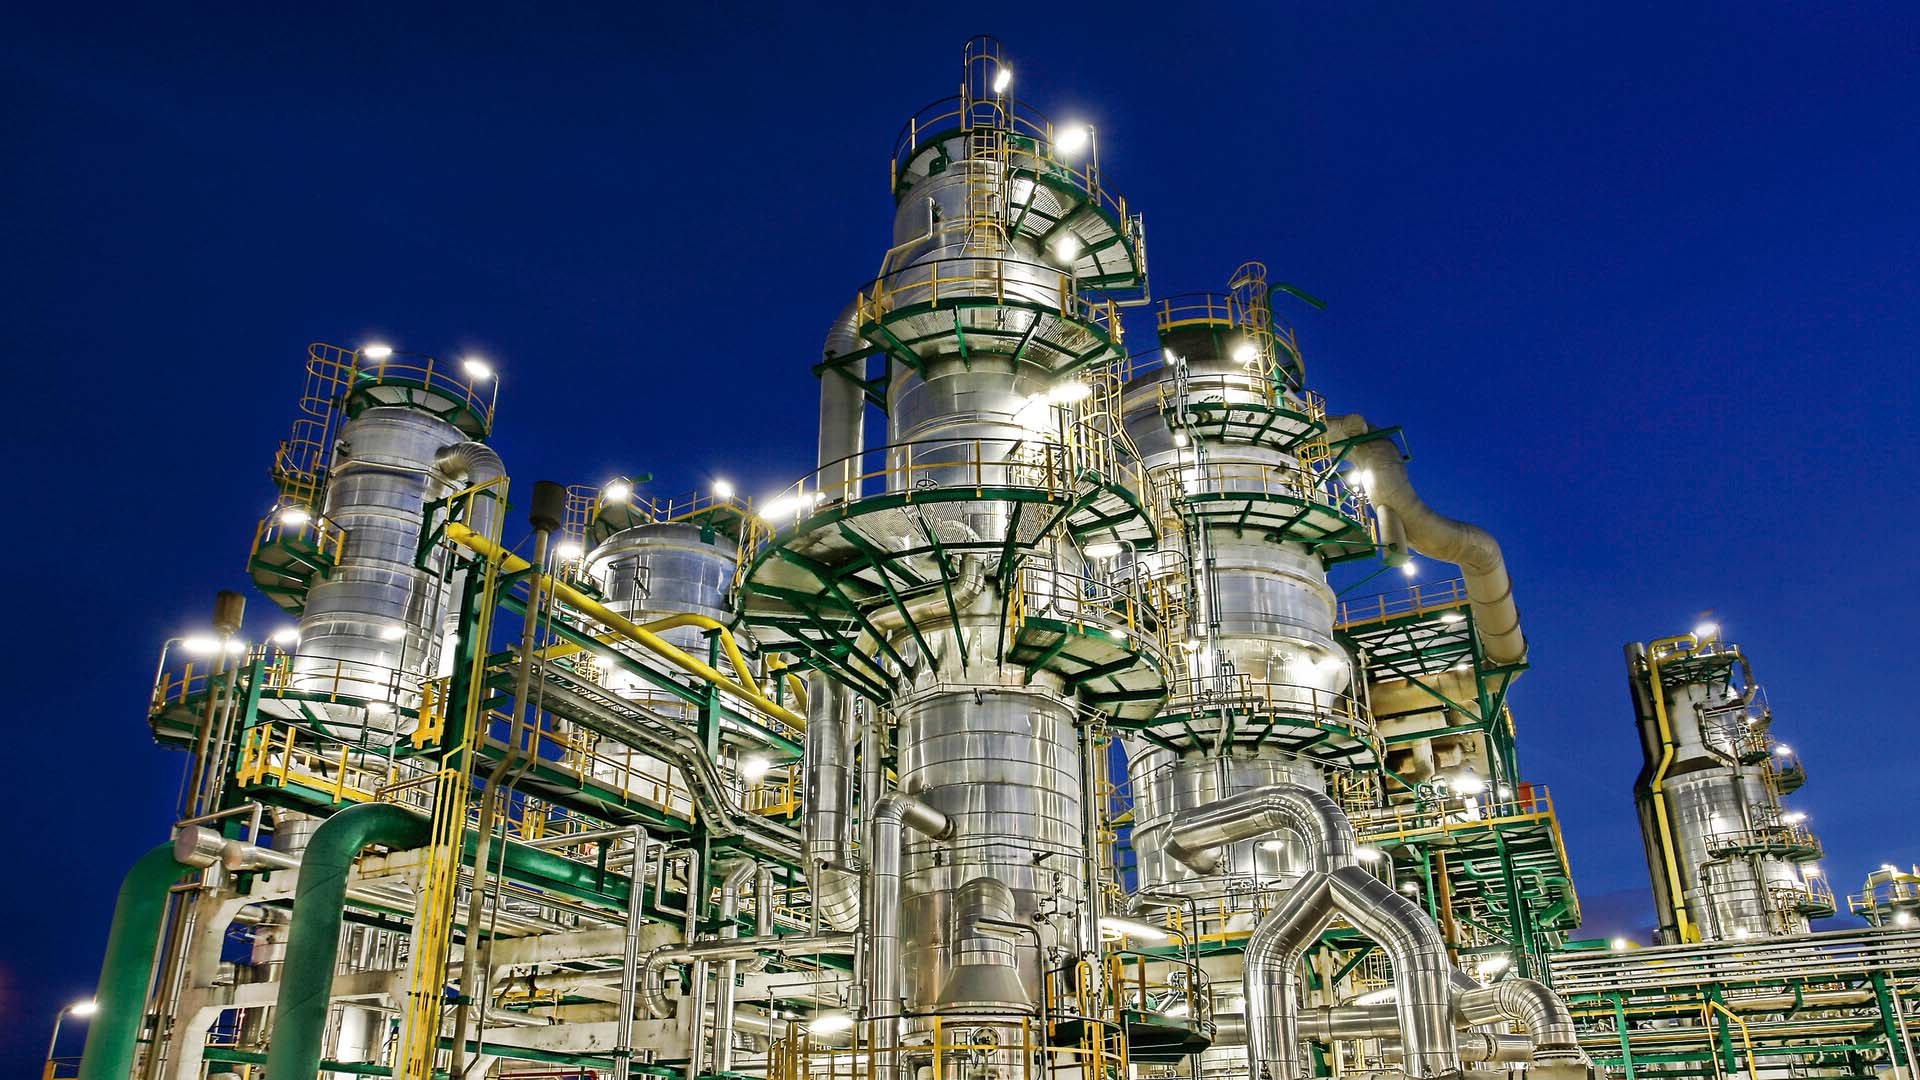
The recent volatility in energy prices, especially the price of natural gas, is the outcome of an asymmetrical shock with the potential of becoming permanent and harming European industry in particular.
Summary
The recent increase in the volatility of energy prices, especially in natural gas, is having a negative effect on European industry in particular. This volatility is likely to endure over time –due to geopolitical and climate factors as well as policies aimed at combatting global warming– and to translate into declines in industrial investment, mainly in energy-intensive sectors, many of which are key to economic security.
Analysis
Although greater attention is often paid to the levels of energy prices rather than to their variability (no doubt because, in the case of Europe, these levels have been consistently higher than those prevailing in the US in recent years), it is important to analyse a phenomenon that is relatively recent but looks set to endure: the greater volatility of energy prices in Europe.
Over the course of this paper it will become evident that, first, there has been a pronounced increase in the volatility of prices in energy markets in recent years, especially in the case of natural gas; secondly, that the shock has been asymmetrical, particularly affecting European industry, largely as a consequence of replacing pipeline-transported gas by liquefied natural gas (LNG), arising from the war in Ukraine; thirdly, that it constitutes a permanent shock, in the sense that it will not disappear in the short term and could even be exacerbated owing to the much-needed efforts to secure an energy transition; fourthly, that this greater volatility poses a major challenges to European industry and, in particular, to overall investment in energy-intensive sectors, one of the Achilles’ heels of European industry. Lastly, a brief overview will be conducted of similar episodes in history in an effort to obtain some stylised facts that might serve as a point of reference for the present day and to draw some conclusions in political economy.
1. The increase of volatility in energy market prices
Although fluctuations of supply and demand are inherent to the energy markets, and a certain degree of volatility is always to be expected (as with non-processed foods, hence the existence of inflation indices that deliberately exclude volatile components), the volatility observed in recent years is far in excess of the trend and its origins must be sought in structural factors linked to global geopolitics and long-term energy trends.
Figure 1 shows the change in prices (blue line) and their volatility (yellow line) for Brent crude oil, WTI crude oil, US natural gas (Henry Hub) and European natural gas (TTF). Volatility has been measured in the conventional way as the standard deviation of the inter-period (in this case, monthly) logarithmic variation in prices, and 12-order moving averages.
Figure 1 gives a visual indication of how volatility has been trending upwards, and in a more pronounced way for natural gas. Figure 2 groups together average monthly volatility in periods of 15 years: in the case of crude oil, it can be seen that volatility has slightly increased since the 1970s (and even fallen slightly in the first decade of this century); it is again notable that in the case of natural gas the increase in volatility has been much more pronounced. In the US this greater volatility emerged in the second half of the 1980s, whereas it is a much more recent phenomenon in the case of European natural gas, only taking off in recent years.
Figure 2. Average volatility of crude oil and gas, 1971-2024 (%)
| Brent crude | WTI crude | US natural gas | European natural gas | |
|---|---|---|---|---|
| 1971-85 | 6.5 | n.d. | 3.3 | 5.1 |
| 1986-2000 | 8.6 | 7.7 | 10.7 | 4.0 |
| 2001-15 | 8.3 | 8.0 | 12.9 | 4.6 |
| 2016-24 | 9.5 | 10.7 | 17.1 | 15.2 |
In the case of crude oil, the volatility of the leading indices in Europe and the US has gone through various episodes over the course of recent decades. After the first oil crisis in 1973, the oil market changed substantially, recording subsequent periods of volatility in 1979 (the Iranian revolution), 1987 (with black Monday on the stock markets and the associated turmoil), 1991 (the first Gulf War), 2009 (the collapse of Lehman Brothers) and 2011-13 (the sovereign debt crisis). The volatility episode that began in 2022, following the Russian invasion of Ukraine, was highly pronounced: according to the volatility measure being used, it was exceeded only by the first oil crisis in the early 1970s. Various caveats should be made, however: volatility in the oil markets has significantly stabilised since the invasion of Ukraine. Moreover, its behaviour has been largely symmetrical between Europe and the US, as is evident from comparing the Brent and WTI indices, which are respectively the most used in the two regions.
An indicator that is complementary to volatility is the number of months in the year when the price has undergone a variation greater than 15%, as shown in Figure 3. Here it is clear that gas has undergone greater variations more frequently (especially European gas, with sharp swings in more than six months of the year between 2020 and 2023).
The volatility episode in the natural gas market that began after the invasion of Ukraine has various singularities. The first of these is its virulence: the volatility gauge used registered its highest value on record both in Europe and the US, exceeding all previous episodes. In particular, to gain an idea of the increase of the volatility in natural gas in Europe it is sufficient to point out that while in the period 2001-15 it was at 4.6%, between 2016 and 2024 it shot up to 15.2%. The increase has been such that, despite increasing in the US too, the differential that has historically existed between Europe and the US (traditionally, natural gas has been more volatile in the US) has almost disappeared.
This has been the second characteristic of the current episode: its asymmetry between Europe and the US. Not only has the increase in volatility been more pronounced in Europe, it has also been corrected more rapidly in the US, remaining by contrast at record levels in Europe. Notably, this asymmetrical increase in the volatility in Europe has not been accompanied by a narrowing in the differential in the price levels with the US. On the contrary, the current differential is even higher than that recorded in the period 2001-15, although it has eased off from the peak levels recorded in 2022 and 2023.
What accounts for this asymmetrical difference between Europe and the US? Whereas the oil market is more homogeneous, in the case of natural gas there are pronounced regional differences: indeed, when referring to natural gas it is common to talk not just about one market but several: Europe, the US and Asia-Pacific. Traditionally, the natural gas market in North America has had lower price levels than in Europe and a higher volatility owing to the abundant domestic reserves of natural gas in the US, the structure of the market (more atomised in the US and more concentrated in Europe) and the supply matrix, with a preponderance of long-term supply contracts via pipelines in Europe. The first two factors account for the lower prices in the US; the second and third for the lower volatility in Europe.
Of these three factors (domestic reserves, level of market concentration and supply method), one of the main consequences of the war in Ukraine has been to eliminate the differences between Europe and the US in the third variable: Europe has changed its natural gas supply method (from pipelines to LNG) in a much more rapid and profound way than its energy mix, as will become apparent below.
As far as the energy mix is concerned, the share of natural gas in the EU’s primary energy consumption has fallen by slightly over two percentage points, from 23% to 20.7%, when the 2018-22 period is compared with the data for 2023. Making up for this reduction, together with that of coal, has been a greater share on the part of renewable sources, mainly wind (with an increase of 2.1 points), solar (1.8 points), but also oil (1.5 points). Despite the extraordinary investment made in renewables, the changes in the energy mix remain gradual and require a sustained effort over a long period of time.
The main change, as pointed out, has not been the reconfiguration of the energy mix so much as the method for supplying natural gas: whereas in 2021 Europe fulfilled 80% of its natural gas needs via pipelines (more than half originating in Russia), by 2024 the percentage had fallen to close to 50%. The shortfall has been made up by greater imports of LNG (which have gone from accounting for 20% in 2021 to almost 50% of the gas supplied to Europe).
A natural gas supply model relying on pipelines generally entails more stable and lasting relations, and therefore more stable prices too. Although the operator-managers of the pipelines are independent companies, the suppliers and purchasers of natural gas tend to establish long-term trading relationships and their interests remain fixed thanks to physical interconnections. LNG supply, on the other hand, has very different characteristics: the LNG markets are global and the product is a commodity, it being much easier to replace particular suppliers (or buyers) with others.
The second characteristic of an LNG supply model is that it also entails higher prices. The price of LNG includes, apart from the cost of the fuel, the cost of liquefication and shipping. This is why LNG prices tend to be, ceteris paribus, higher and more volatile than those of natural gas supplied via pipeline.
Normally it is the level of prices that attracts all the attention. When natural gas prices skyrocketed in 2022, European countries took extraordinary measures, including a set of tax relief measures supported by the European Commission. The subsequent fall in prices came as a relief to domestic and industrial consumers. The increase in volatility will take much longer to dissipate, however. As argued below, the factors that account for an increase in volatility in Europe (fundamentally, transitioning from a pipeline to an LNG supply matrix and from indexed long-term contracts to other, more flexible, spot markets) is a factor that will create a greater structural volatility in European energy prices over the years ahead. Europe will thus find itself at a twofold competitive disadvantage. Up until now, the higher level of prices in Europe relative to the US were compensated, at least in part, by less volatility (in a sense, Europe paid a toll in the form of higher prices but benefitted from greater price stability). Offsetting higher gas prices (due to a shortage of domestic reserves and other structural factors), the substantial investments in connection infrastructure enabled Europe to enjoy a greater price stability. Now, by contrast, whereas the European price differential persists (and has even increased in recent years), the reduced price volatility in Europe has virtually disappeared.
2. Why are gas prices so important?
Natural gas is a raw material that is used directly by industry (to create heat at high temperatures) and domestic consumers (for heating and other domestic uses). It is also used in the production of electricity (around 20% of the electricity generated in Europe), although owing to the marginalist configuration of Europe’s electricity markets, its importance in the setting of prices is much greater. Its effect thus extends in multiple directions.
The pronounced effect of natural gas in setting the electricity price combines with the growing importance of electricity to European industry’s energy consumption (where it accounts for a third of the energy consumed), compared with the US, where it scarcely accounts for 13% and is more stable). The existence of long-term contracts and the absence of detailed statistics, however, hampers any detailed analysis of its volatility.
In short, natural gas prices play a systematic role in industry, both directly and indirectly. Hence, both the increase in prices and their greater volatility represent a challenge to industry worldwide and to European industry in particular, given its energy dependence. Before analysing the factors that explain this volatility, it is essential to study the way industry’s contribution to GDP has evolved as well as its energy distribution and intensity.
3. The industry’s share of GDP
Industry accounted for 20.6% of the EU’s gross value added (GVA) in 2023, with major differences between countries (from Germany’s 25% to Spain’s 17%). Industry’s contribution to GVA has waned in recent decades, although the decline is more pronounced in nominal than in real terms. A large part of the decline can be traced back to the start of the 1990s when, tapping into developments in information and communication technology, worldwide production became fragmented into global value chains (between 1990 and 1995 the strength of industrial GVA fell almost 6 points in Germany, partly also as an effect of reunification). The decline in industrial GVA accelerated until 2009, since when it has held steady and even recovered in some cases. Between 1995 and 2023, industrial GVA lost 3 points in nominal terms in the EU, 4.6 in Spain, 1.5 in Germany, 4.4 in France and 3.5 in Italy; in real terms the EU lost 0.9 points, Germany gained 0.4 points, Spain lost 4.4, France 2 and Italy 4.1.
Part of this relative loss is due to the general trend towards offshoring industrial production to Asia, in particular to China. Indeed, despite the fact that the US has been gaining energy autonomy, between 1997 and 2021 its industrial GVA lost almost 6 points in total.
4. The energy distribution and intensity of industrial GVA
As well as taking industrial added value’s share of the total into account, it is necessary to consider the quantity and composition of energy consumed by industry. In this regard, whereas the industry of the EU-27 consumed 310,000 tonnes of oil equivalent (toe) in 1990, in 2022 it consumed barely 226,000. Between 1995 and 2022, European industry was capable of producing 53% more in real terms while consuming 17% less energy.
This general trend conceals divergences between countries. Thus, Spanish industry in the same period produced 30% more with 9% less energy but following a different path: between 1995 and 2005, whereas energy consumption in Europe remained stable and output increased by 25%, 52% more energy was consumed in Spain to produce 37% more (in other words, with less energy efficiency than in the EU).
Figure 7. Final energy consumption and GVA in EU and Spanish industry (000s toe)
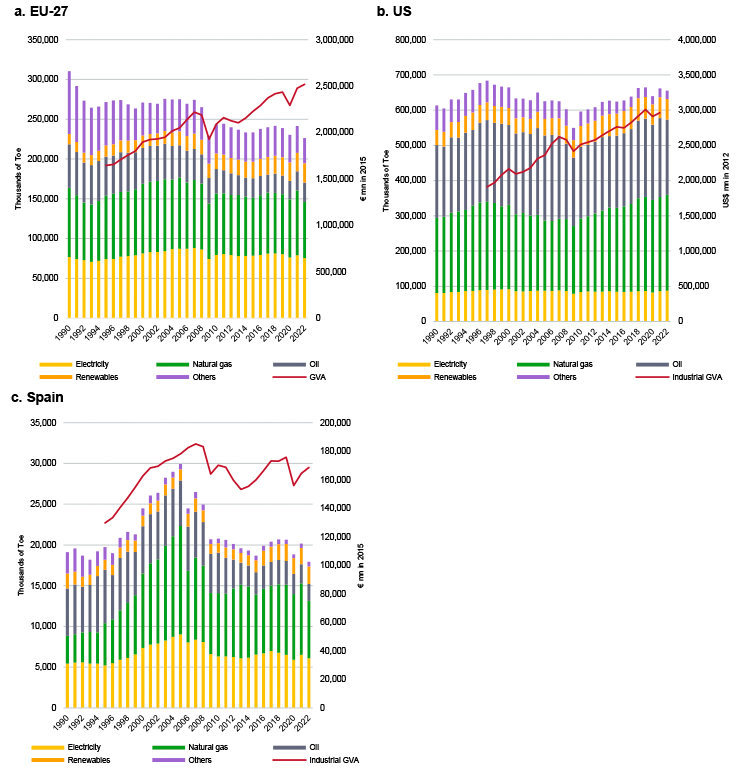
Figure 8. Final energy consumption in industry: EU, US, Germany and Spain (%)
| EU-27 | EU-27 | EU-27 | US | US | US | Germany | Germany | Germany | Spain | Spain | Spain | |
|---|---|---|---|---|---|---|---|---|---|---|---|---|
| 1990 | 2005 | 2022 | 1990 | 2005 | 2022 | 1990 | 2005 | 2022 | 1990 | 2005 | 2022 | |
| Electricity | 24.7 | 31.7 | 33.3 | 13.3 | 14.0 | 13.4 | 28.1 | 36.4 | 33.4 | 28.5 | 30.2 | 33.9 |
| Natural gas | 28.1 | 32.6 | 31.2 | 36.8 | 31.9 | 41.5 | 25.7 | 35.3 | 33.9 | 17.8 | 44.4 | 39.3 |
| Oil | 17.6 | 14.6 | 10.8 | 32.7 | 38.6 | 32.5 | 10.8 | 8.3 | 7.0 | 30.5 | 18.7 | 11.6 |
| Renewables | 4.2 | 6.4 | 10.6 | 7.5 | 7.5 | 8.9 | 1.2 | 3.9 | 6.8 | 9.6 | 4.5 | 11.8 |
| Others | 25.4 | 14.6 | 14.0 | 9.8 | 8.1 | 3.6 | 34.2 | 16.2 | 19.0 | 13.7 | 2.2 | 3.3 |
| Total | 100.0 | 100.0 | 100.0 | 100.0 | 100.0 | 100.0 | 100.0 | 100.0 | 100.0 | 100.0 | 100.0 | 100.0 |
Having seen the importance of various energy components to industrial GVA, it is important to explain the reasons that underlie the growing volatility in energy prices. It is worth distinguishing between at least three types of factors: geopolitical, climate-related and energy transition-related.
5. Geopolitical factors
Geopolitics has always played an influential role in economics, more so in the energy sector (lest it be forgotten, the oil crisis of the 1970s, which will the subject of further discussion below, had a major geopolitical component linked to the Middle East). The problem is that geopolitics has completely invaded economics to the extent that it has become the main economic risk factor in recent years. The invasion of Ukraine had an enormously distorting effect on energy prices, by affecting not only Ukraine but also the energy supply originating from sanctions-hit Russia.
The gas interconnections between Russia and Europe date back to the start of the 1970s, when they formed part of the energy supply within the Soviet bloc. During the latter half of the 70s and beginning of the 80s, precisely as a response to the oil crisis and as part of the so-called Ostpolitik, interconnections were constructed with the western European network, which were gradually extended over the course of subsequent decades. European energy supply since then has been characterised by the importance of Russian gas, albeit with notable differences: Russia provided, up until the invasion of Ukraine, virtually all the gas supplied to the Baltic states, Slovakia and Bulgaria, more than half to countries such as Germany, Austria and Poland, and an almost token amount to the Netherlands, Belgium and Spain.
The war in Ukraine created an unprecedented energy crisis throughout Europe. Brent crude went from a 10-year low in April 2020 to a 10-year high of more than US$119 per barrel in March 2022. Meanwhile there was an 80% reduction in the supply of Russian gas. Overall, the EU imported around 140 bcm of gas through pipelines in 2021, a figure that has now fallen to below 25 bcm (although imports of Russian LNG have risen). The EU has, moreover, set a target of reducing imports of Russian fossil fuels to zero from 2027.
An important factor for preventing volatility is the existence of both gas and electricity interconnections between neighbouring countries, enabling more precise adjustment of supply and demand. Here, geopolitics plays a fundamental role in the willingness to support interconnections of this type, because they alter the energy and dependency balances, anchoring all parties’ interests over the medium and long term. Precisely for this reason, interconnections are more difficult to instal in systems where various nation-states are involved, owing to the complex alignment of all the interests, as in the case of the EU.
Moreover, the geopolitical problems of the Mediterranean region and the Middle East, which affect some of the main suppliers of gas to Europe, such as Egypt, Qatar and Azerbaijan, represent an additional destabilising factor, an extra risk premium that has again placed strain on European gas prices in recent months. Geopolitical instability in this region also has the prospect of becoming an enduring factor, one that is likely to persist in the years ahead.
Among the geopolitical factors, it is worth including trade policies under their own heading, because in recent years they have swung towards greater protectionism, as well as more aggressive industrial policies, all elements that contribute to an increase in price volatility.
The geopolitical factor is an indispensable element for understanding the greater volatility of European energy prices in recent years. Most importantly, it is not a fleeting factor. Even a drastic change in the Kremlin’s foreign policy (or an improbable reduction in the tension between Israel and Iran) would not entirely succeed in restoring the energy supply relationships that the vast majority of European countries enjoyed in recent decades. To make matters worse, this geopolitical uncertainty comes at a particularly delicate time in the fulfilment of the climate targets and the energy transition.
6. Climate-related factors
Climate change is an undoubted source of energy price volatility, both on the supply and on the demand side. On the supply side, the increase in extreme meteorological phenomena such as storms, flooding and hurricanes can lead to power cuts and damage to the productive infrastructure and the electricity network. On the demand side, the greater range of temperature variation (extreme heat and cold) can give rise to unexpected peaks in demand (air conditioning and heating).
The pandemic, while not a climate-related factor, does constitute a natural catastrophe and unleashed the greatest sustained change in demand since World War II. Before COVID-19, worldwide demand for oil was around 100 million barrels per day, but the lockdown of over 3 billion people caused demand to plummet and around five billion barrels of oil produced daily throughout the world did not reach sufficiently high prices to cover the cost of extraction. Just when the market had begun to stabilise, driven by a gradual post-pandemic recovery and restrictions surrounding production, the war in Ukraine broke out.
The EU has committed itself to reducing greenhouse gases by at least 55% by 2030, compared with their 1990 levels, and over the longer term, becoming the first economy with net zero emissions by 2050. According to the latest progress report, the EU’s emissions were 32.5% lower in 2022, an achievement that puts the EU at the forefront of efforts to combat climate change. Even so, the additional effort over the years ahead to comply with the 2030 commitments is similarly extraordinary, which has led the present decade to being dubbed the ‘critical decade’ in the efforts to halt climate change. It is precisely during this ‘critical decade’ when the mismatch between plans and reality is greatest, thereby creating an additional element of uncertainty (and with it, volatility in the markets), the scenarios of future developments being highly varied.
The Ukraine crisis emerged at a crossroads in time: too early for the effects of the energy transition to have been registered in European energy markets, but too late in the sense that the effects of climate change had already been felt.
7. Factors linked to the energy transition
Renewable energies were initially conceived as sources that would complement other more stable sources such as coal, gas and nuclear energy. The green transition means that the renewables, which by definition are less stable (since they depend on such factors as rain, wind and sunshine), have come to occupy a preponderant role in the energy mix. This raises various problems. On the one hand, at times of high renewable production, there may be surpluses of supply that cause prices to plummet (or even negative prices in some markets). On the other hand, at times of low renewable output, the need to use scarcer back-up energies (generally fossil fuels) may create sharp peaks in prices.
The problem of the volatility of renewables may be solved as improvements are made in energy storage systems with batteries that are fully integrated into the network, the electricity interconnections, the measures of demand management and smart networks, among other factors. Meanwhile, there is a shift from variable costs to fixed costs, which could reduce price volatility, provided that the price-formation mechanisms (and the regulations) reflect this new configuration of the markets.
Meanwhile, the Paris Agreement requires major investments that are not always affordable. The International Energy Agency (IEA) estimates that some US$510 billion per annum will need to be invested in the oil and gas sector between now and 2040 to meet the targets of the Paris Agreement. At the same time, it is estimated that the oil-producing states may lose income to the tune of US$13 trillion as a result of the switch to green energy by 2040.
There are still many uncertainties that surround the energy transition. There are, however, some foreseeable vectors of evolution, such as a greater share for electricity in the final energy mix (owing to its rapid growth in domestic consumption and, albeit with a greater time lag, in the industrial and transport domains), to the detriment of fossil fuels. The development of hydrogen is still at an incipient stage, although its applications in energy-intensive industries have promising prospects. The energy transition, in particular the so-called critical decade, the current one, is a period marked by many imbalances and vulnerabilities, such as the uncertainty surrounding the development of certain technologies. Meanwhile, the traditional fossil fuel markets are losing flexibility, as investments are cut. Although it is foreseeable that, taken together, all these changes will result in less volatility in energy systems in the long term, we are still far from reaching this stage and, if anything, destabilising factors may even be exacerbated during the transition.
8. Regulatory factors
One of the most hotly debated questions over the last year has been the reform of the electricity market, finally culminating in Directive EU/2024/1711 and Regulation EU/2024/1747, which came into force in July 2024. One of the strands of the debate sought to address the very question of the evolution of the electricity markets, preventing the preponderance of wholesale markets and the marginalist configuration in which they operate from acting as echo chambers. It is thought that the regulation of the markets may have amplified the fluctuations of raw material prices (such as natural gas) in the price of electricity, when the goal is exactly the opposite. Thus, one of the lines of action is the promotion of bilateral long-term contracts, one of the recommendations of the Draghi report.
Similarly, in the natural gas market, for many years the emphasis was on the need to have transparent benchmark indices (such as the TTF or the NBP in the UK) as a mechanism for improving transparency, as opposed to bilateral contracts, with adjustment mechanisms and clauses known only to the signatories. This greater transparency could effectively entail greater price volatility, as argued here; but thanks to their existence, more efficient signals have been sent to the agents, mainly consumers.
The outbreak of volatility in the energy markets that has been witnessed in recent years seems to have acted in the opposite direction: the emphasis on spot markets and benchmark indices has disappeared, and many of the recommendations go in the opposite direction, a kind of return to the ‘old days’ of fixed-term contracts, which are less transparent but more stable.
In the current authors’ opinion, far from endorsing this sudden pivot towards less transparent market regulations (apart from the fact that their regulation should indeed be adapted in certain cases), these recommendations, inasmuch as they translate into pressures for complete reforms of the market, as in the case of the electricity market, constitute additional factors of uncertainty that will do nothing but increase the volatility of prices over coming years.
9. The industries that are most affected
The volatility of energy prices has a substantial effect on the most energy-intensive industries, given that it determines their profitability and their long-term investment decisions.
The most energy-intensive industries in the EU are the petrochemical industry, non-metallic minerals, papermaking, agri-food, iron and steelmaking and machinery. These six account for 72% of the electricity and 83% of the gas consumed by industry. Most of the oil is used by the petrochemical, non-metallic minerals and construction industries, and coal is used by the petrochemical, non-metallic minerals and iron and steelmaking industries. Renewables play an important role in the papermaking and timber industries.
The most energy-intensive industries in Spain are the same six (consuming 69% of electricity, 81% of gas and 87% of oil), although the non-metallic minerals industry (ceramics, for example) exceeds petrochemicals. The Spanish petrochemical industry barely uses oil, however. Renewables are important, not only for the paper and timber industries, but also for agri-food.
German industry exhibits similar characteristics. One notable feature here is the major difference in energy consumption between the petrochemical industry and what follows it, iron and steelmaking (almost 80% more). There is also a striking presence of coal in the energy mix.
10. A glance at the past: the energy crises of the 1970s
With all due caveats when comparing historical episodes, it is possible to go back to the energy crises of the 1970s to find an episode similar to the current one, featuring a sharp increase in energy price volatility with long-lasting effects. What follows is a brief recap in order to draw some conclusions.
What have become known as the oil crises took place in 1973 (the Yom Kippur War) and 1979 (the Iranian revolution), although their ramifications lasted much longer. The first erupted after the oil embargo imposed by various Arab countries, following the military aid supplied to Israel by the US and other countries during the armed conflict. The second removed Iran (one of the world’s largest oil and gas producers) from the international markets, providing Saudi Arabia with a crucial role that for all intents and purposes it has maintained ever since.
Although the crises of the 1970s are often associated with a permanent increase in the level of energy prices, the reality was somewhat different. The price of oil in the spot market skyrocketed during the crisis, but many countries benefitted from medium-term contracts that protected them for some time. The sharp increase in prices was rapidly corrected, at least in part, and the 1980s were a time of relatively low energy prices. Apart from the upturn precipitated by the first Gulf War at the start of the 1990s, the rest of the following decade also witnessed relatively low prices, before the so-called commodity super-cycle drove energy prices to much higher levels in the 2000s.
Rather than the levels, what triggered the crises of the 1970s was a sharp increase in market volatility. Between 1948 and 1970, the price of a barrel of WTI moved within a very narrow range, between US$17 and US$20. Volatility was virtually non-existent. Since then, however, episodes of volatility in the oil market have been both extremely frequent and much more intense.
Precisely the sharp increase in volatility was one of the factors that reconfigured trading relationships in this market: medium- and long-term oil supply contracts became much less common, and the majority of traders migrated to the spot market. Oil became a commodity and the markets became global, amplifying the consequences of greater volatility by affecting a greater number of economically productive sectors.
The situation in which the European gas market currently finds itself bears various similarities to the earlier episode: it is not only the level of prices that is concerning but also, and above all, the sharp increase in volatility and how this is reconfiguring the market by reducing fixed-term contracts and enlarging the spot market, which, in turn, means that price fluctuations affect a greater number of productive sectors.
A greater price volatility is a factor that tends to suppress investment, particularly in the most energy-intensive sectors: the investment gapthat exists between Europe and the US, especially acute in certain sectors (such as telecoms, software and databases, and other productive investments) could even become wider as a result of this asymmetrical volatility shock. The problems energy-intensive industries (automotive, chemicals, steel and cement) face in order to compete in international marketplaces will be exacerbated as a result of the greater price volatility.
Conclusions
The volatility of energy prices has the potential for having an even greater bearing on investment and growth than their price level, as the experience of energy crises in the past century suggests. In recent years, the acute volatility of energy prices and of natural gas in particular has especially affected the EU (which is much more energy-dependent than the US) and, within the EU, its energy-intensive industries. This problem arises in an adverse geopolitical context, characterised by a sharp polarisation and a decline in international cooperation, and it is likely that it will persist, given that it coincides with other structural factors tending to trigger price variability, such as climate change, the design of the energy transition (with a progressive decoupling from fossil fuels) and the existence of aggressive industrial policies in the main economies.
Experience suggests that the authorities’ efforts should focus on reducing the sources of volatility, rather than the differences in price levels, because economic agents are better placed to internalise the latter into their decisions. Some of the measures contained in the Draghi report are aimed in precisely this direction, such as the recommendation to enhance the use of so-called power-purchase agreements (PPAs) or long-term electricity supply contracts, the implementation of which is far more extensive in the US than in Europe. However, it is also worth pointing out the disadvantages of fixed-term contracts to the detriment of the spot markets(such as less transparency and less efficient signals conveyed to agents). An abrupt change in the configuration of markets could have counterproductive outcomes for the progress made in recent decades in European energy markets.
The restructuring that many of Europe’s productive sectors went through at the start of the 1980s (steel, mining and shipbuilding) does not necessarily have to be repeated now. It is, however, worth drawing certain lessons from the restructuring processes that took place then, such as the advisability of acting sooner rather than later in the face of an enduring shock –as the energy shock seems likely to be– while also being clear about the differences between sectors, focusing efforts on those where the competitive position of European companies still offers realistic opportunities for competing in international markets.