Theme
This paper[1] analyses the impact of climate change on the global and regional availability of wind and wave renewable energy resources.
Summary
The energy provided by wind and waves is considered one of the most promising sources for mitigating climate change. This paper explains the various analyses carried out, using different models, in order to simulate both past situations and future predictions. In this respect, both wind and wave resources have been analysed, at the global and regional levels, as well as the electricity production associated with them, often using standard devices[2] for this purpose. The possibility of combining both technologies has also been studied by looking for optimal locations for the application of this wind-wave combination, as well as considering the possible mechanical fatigue that a wind turbine might suffer when coupled to a floating system. In any case, it concludes that, except in very specific regions (the Arctic and the Southern Ocean or, more locally, in the Bay of Guinea or southern Brazil), wind and wave resources, as well as the associated electricity production, will not be significantly affected by climate change in the long term, even in the most unfavourable scenario analysed. This stability translates into consistent power generation, making the existing wind and wave renewable energy plants long-term reliable sources.
Analysis
1. Introduction
Marine energy is one of the levers for the energy transition in the medium and long terms at the national, European and global levels. Marine energy not only presents high resource regularity and predictability, but also versatility –for both onshore and offshore implementation–, modularity and scalability to provide electricity to a variety of end-use sectors such as, among others, ports and desalination plants. Thus, the use of wind and wave energy is crucial to mitigating climate change. These renewable energy sources are clean, sustainable and do not emit Greenhouse Gases (GHG), making them a key alternative to the use of fossil fuels that contribute to climate change. In fact, during the COP28 climate summit, held in Dubai in November and December 2023, there was a specific call for trebling the global renewable energy capacity by 2030.[3]
Additionally, offshore wind is accelerating its technological and industrial development. According to IRENA’s projections, in order to meet the Paris Agreement targets –to keep the rise in global temperatures this century well below 2°C and striving to limit the temperature increase to 1.5°C compared with preindustrial levels– the total offshore wind capacity required globally will be 228 GW in 2030 and 1,000 GW in 2050.[4] Besides, according to the International Energy Agency, offshore wind will account for half of Europe’s wind generation by 2040.[5]
On the other hand, wave energy is also a promising marine resource, even if its evolution has not been as rapid as expected. According to the International Energy Agency’s Ocean Energy Systems, the world has the potential to develop 300 GW of wave and tidal energy by 2050.[6] In turn, the EU has set an ambitious target of reaching 40 GW of installed capacity in wave and tidal energy by 2050, so that, to achieve it, the required evolution of cumulative installed capacity should be 1 GW in 2025 and 10 GW in 2030.
The following analysis is based on the authors’ research on the global and regional availability of wind and wave renewable energy resources. In fact, not only the resource has been analysed, but electrical energy/power production as well. Their seasonal and daily variability have been also analysed and, finally, the optimal combination of the renewable wind-wave resources has been studied, where fatigue analyses have shown a strong reduction in the long-term life-span of offshore turbines, affecting energy production over the entire life of these machines.
These analyses have been carried out using different models, either considering historical data or by forecasting future results.
Currently CMIP6 models[7] provide future scenarios for atmospheric variables such as temperature and wind depending on different pathways until 2100. These pathways combine future estimations of GHG emissions as well as adaptation and mitigation policies.
Two boundary scenarios to describe this joint evolution until 2100 are usually considered: (a) the low-emissions SSP1-2.6 scenario, that could be described as a ‘green’ scenario; and (b) the high-emissions SSP5-8.5 scenario, that represents a less environmentally friendly evolution until 2100.[8]
It is usually considered that intermediate scenarios (the most likely given current policies that could lead to temperature increases of around 3ºC) will also exhibit an intermediate evolution –in terms of wind and wave energy production for this specific case– between the two scenarios mentioned above. This approach is usually carried out when, as in this study, direct outputs from the CMIP6 models do not provide energy estimations, so that considerable amounts of data treatment are necessary to estimate power production from high frequency data.
2. Wind and wave worldwide electrical production analysis for 2015-2100 period
In this section, CMIP6 future wind estimations are processed to obtain final energy outputs generated from wind turbines and wave devices. To that purpose, a standard wind turbine and a specific wave energy converter type1 have been selected and their future electric output calculated using future wind and wave estimations as inputs. Global decadal trends have been estimated for the 2015-2100 period in the coastal areas where according to current-day technological developments wind and wave devices can be deployed worldwide.[9]
Figures 1 and 2 show the results corresponding to the decadal trends of energy production of wind and waves. These plots correspond to the intermediate (average) trends between the boundary SSP5-8.5 and SSP1-2.6 scenarios.
The results provide an almost static picture with only a few areas where some significant, though limited changes in offshore generation can be expected.
The results also indicate that despite significant changes expected in the Earth’s temperature until 2100, this does not compromise the future production of offshore energy and only in a few locations moderate changes can be expected. There is a consensus that climate change needs to be addressed, among others, by increasing the share of renewable energies and reducing the use of fossil fuels. This work suggests that the expected increase in temperatures will not hinder the efforts towards a reduction in GHG emissions, at least as far as the offshore renewable generation capabilities are concerned.
Figure 1. Wind energy production trends: SSP1-2.6 scenario
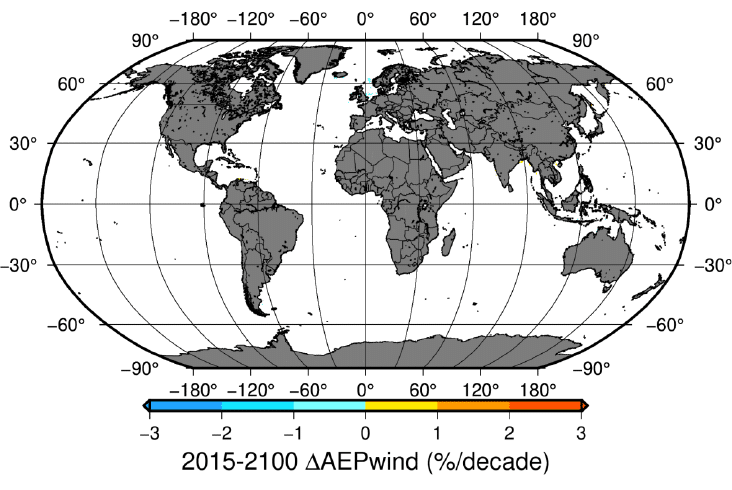
Figure 2. Wind energy production trends: SSP5-8.5 scenario
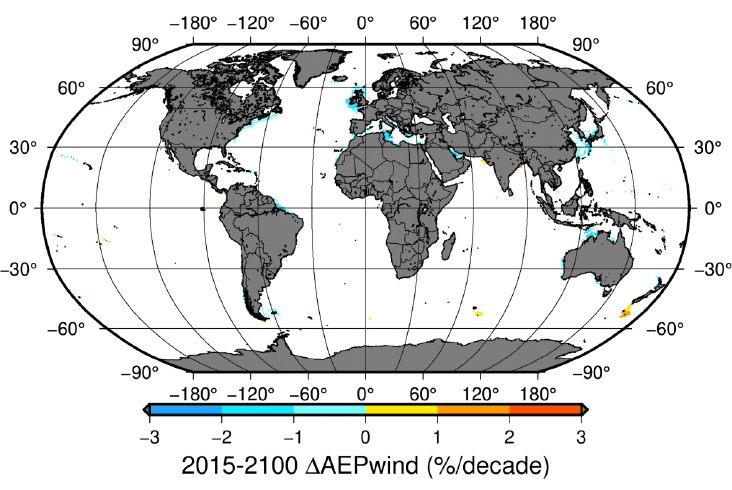
Figure 3. Wind energy production trends: intermediate scenario (average between SSP1-2.6 and SSP5-8.5)
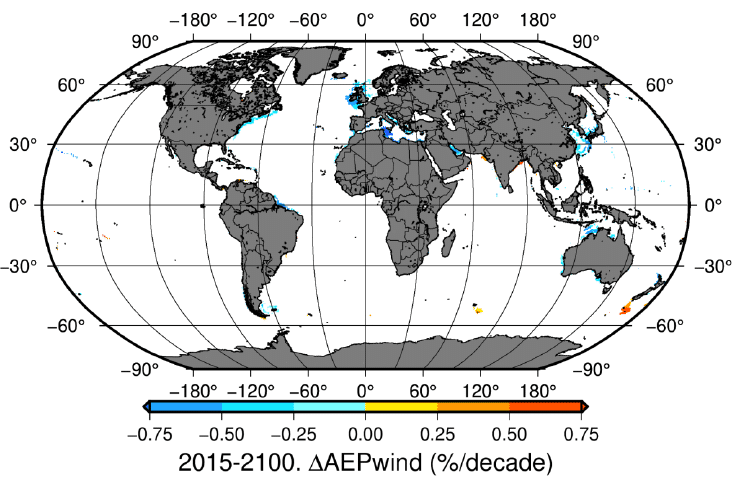
Figure 4. Wave energy production trends: SSP1-2.6 scenario
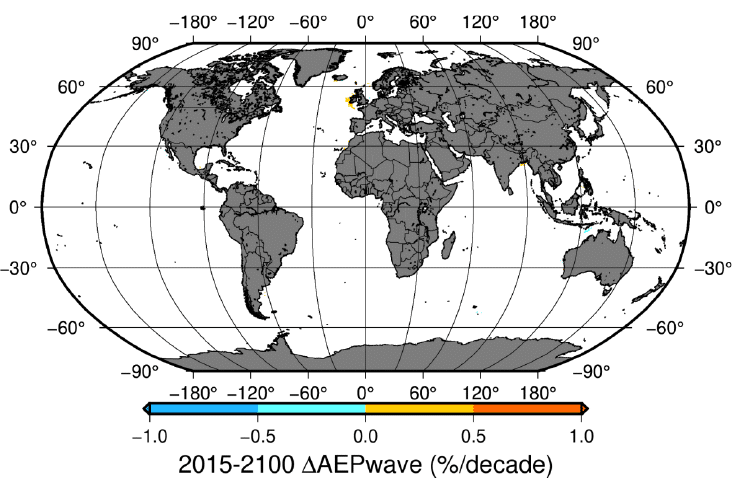
Figure 5. Wave energy production trends: SSP5-8.5 scenario
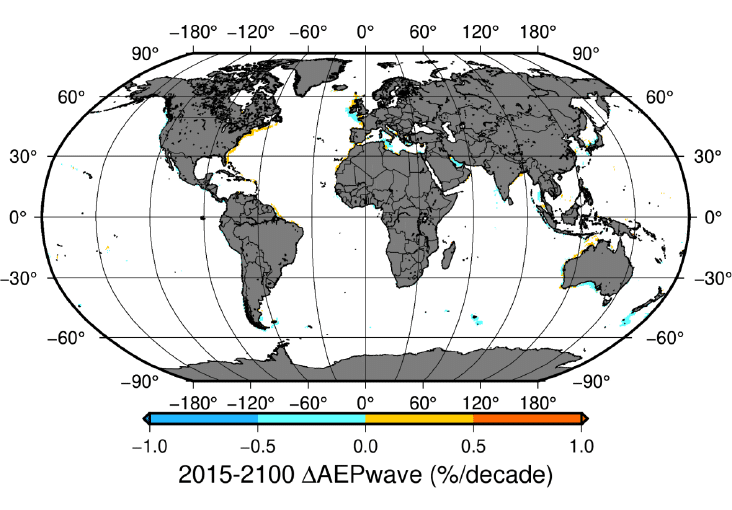
Figure 6. Wave energy production trends: intermediate scenario (average between SSP1-2.6 and SSP5-8.5)
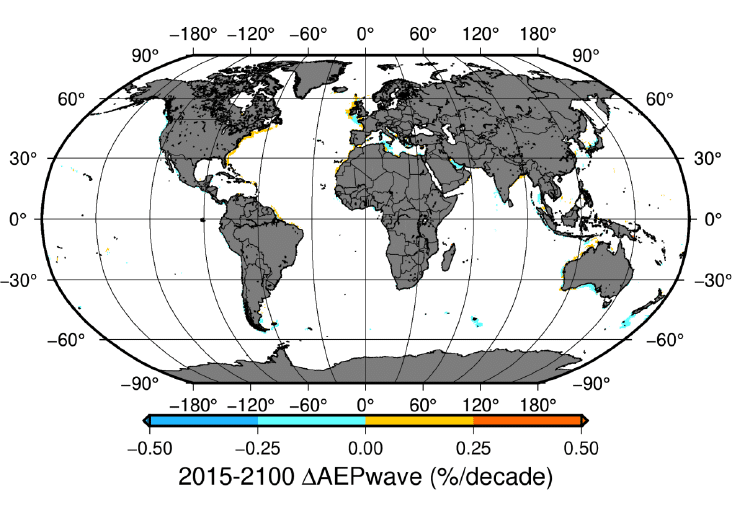
2.1. Wave electrical production analysis for the 2015-00 period in the Mutriku Wave Energy Plant
The Mutriku Wave Energy Plant is located in the Bay of Biscay in the northern region of the Iberian Peninsula (Spain). This grid-connected plant is integrated within the breakwater at Mutriku harbour. There are 16 air chambers that lead to a Wells turbine and electrical generator of 18.5kW for each air chamber, yielding a total of 296kW installed capacity. Up till now, the Mutriku Wave Energy Plant has supplied more than 2.4GWh of electricity to the grid.[10]
In order to analyse the electrical production for the 2015-2100 period at this specific location, an ensemble of CSIRO wave projections derived from six different climate models participating in the CMIP6 model runs have been used.[11] Two of these models are associated with the SSP1-2.6 scenario, while the remaining four correspond to the SSP5-8.5 scenario.[12]
The conclusions obtained indicate that wave energy production in the Bay of Biscay should remain stable in the 2015-2100 period under study. An analysis of daily sea state frequencies and power output revealed no significant changes. This stability translates into consistent power generation, ensuring the Bay of Biscay’s potential as a reliable and long-term source of renewable energy. Similar results are expected for the intermediate scenarios.
3. Wind electrical production analysis for 2015-00 period: the influence of air density variations
Almost all studies on present and future wind energy resources focus on Wind Power Density (WPD), calculated using constant air density. The latter, however, inversely depends on air temperature, and to a lesser extent on air humidity. Increasing future temperatures implies decreasing air densities and accordingly decreasing future WPD. Spatially variable, but in general, decreasing future WPD has been described in many global and local studies based on CMIP5 and CMIP6 models, especially in mid and high SSP scenarios. Such studies, however, do not take into account the effect of decreasing air densities, which can take place with spatial coherence with decreasing WPD patterns, hence magnifying them, or affect areas with no expected WPD under constant density assumption, inducing a decreasing WPD effect. The lack of determination of future Annual or Seasonal Energy Production (AEP or SEP), the expected power outcome of installed turbines, is also a weakness of previous studies. This implies the use of the spectrums of future wind speed combined with real world wind turbine power curves. Hence, it offers a more complete view of the future wind-energy production problem, allowing to consider changes all over the spectrums and not only in mean wind conditions. Such strategy, in addition, can greatly benefit from the use of the highest available time frequency of future CMIP simulations to include the effect of sub-daily wind variability (by using the highest time-resolution of three hours in the CMIP6 repository) in the determination of the wind spectrums.
A recently published study[13] has estimated changes of future wind speed, air density, density-aware WPD and energy production (AEP and SEP) compared with the reference values of the historical period for all CMIP6 SSP scenarios, but only results related to intermediate scenarios, SSP2-4.5 and SSP3-7.0, have been presented here. Results by previous studies regarding wind speed and WPD have been confirmed, showing an overall decrease in many locations over the northern hemisphere, including areas of well-developed wind energy industries, and increasing values in polar areas. Almost all changes additionally show seasonal modulations. Considering the relationship of the changes with the future radiative forcing, the global pattern of changes is clearly identified already in SSP2-4.5. Then, it is basically magnified, regarding both the rate of change and the extension of the affected areas, when undertaking an analysis under SSP3-7.0.[14]
Future changes of AEP and SEP are shown to be coincident with WPD changes but to include additional areas of basically decreasing values, especially over the oceans. Roughly speaking, AEP changes are expected to be in the range of -20% to +15% for SSP2-4.5, while in the range of -25% to +20% for SSP3-7.0, depending both on the area and season.
It has been concluded that energy production is expected to decrease or remain unaltered in most locations even for the worst-case scenarios, but with a few exceptions like over the Arctic and the Southern Ocean, or more locally in the Bay of Guinea or southern Brazil.
4. Wind electrical production analysis for the 1950-2019 period: the influence of the ice on the turbines
Freezing conditions during several days in cold regions are a significant challenge for wind turbines. Ice accumulates on their mechanical and instrumental components, leading to substantial losses in AEP. To that end, Freezing Temperatures Frequency (FTF) at 100m in cold regions and high latitudes (50°N, 75°N) for the period 1950-2019 have been analysed.[15] The main objective of this study has been to estimate AEP losses caused by ice accretion to enhance the characterisation of wind farms.
The study reveals an average decrease of 72.5 FTF hours per decade in cold regions. Notably, the south-eastern coast of Greenland experiences the most significant reduction (621 hours per decade). Additionally, a specific location in Scandinavia has been projected to see a remarkable 60% annual reduction in FTF hours. Moreover, considering the classification defined by the International Energy Agency, a maximum AEP increase of over 26% is projected. This means that the increase in temperature does not compromise, but rather significantly favours, the generation of wind energy in cold regions.
5. Wind-wave electrical production analysis
Further research has been carried out in recent years on the combination of wind and wave renewable energy sources.
5.1. Wind-wave technology for far offshore applications
There are large areas of the ocean where the availability of offshore renewable energy resources (wind and wave) is very high. However, at distances of hundreds or thousands of kilometres from the nearest coast, it is impossible to integrate that electricity into the distribution grid. Therefore, the possibility of combining wind and wave renewable energy for in-situ hydrogen generation has been analysed, as it could later be transported to end users.[16]
For this purpose, four points have been identified in the Atlantic Ocean, where it has been assumed that mixed hydrogen production plants could be located using wind and wave energy. In these four points, the energy produced from wind and wave fields in hourly resolution during the decade 2010-2019 was simulated from information obtained from the ERA5 re-analysis.[17] These four points have been selected from the existing covariance between wind and wave energy resources. They are representative of points in which the covariance is very high and, conversely, points in which the covariance is low.
The methodology used has allowed us to realistically analyse the contribution of the combination of different types of wave converters to the energy generated by a wind turbine for hydrogen production in remote locations far from the coast. This contribution would complement the energy that the turbine fails to produce during its shutdown periods. The results indicate that up to 6.28% more hydrogen can be generated using WECs than the amount the wind turbine alone would generate, leading to an improvement in the efficiency of remote energy production systems. The latter have the highest efficiency at points where there is little covariance between wind and wave energy, since in these areas wind turbines remain at a standstill during times when waves still produce energy. Concerning the cost of this type of energy, even if there are some articles on the matter,[18] [19] this is an aspect that still needs to be studied in depth.
5.2. The wind-wave energy index in the Canary Islands
This research has focused on wind and wave energy potential near the Canary Islands (Spain).[20]
It was found that wind speeds have increased historically, but, on the contrary, wave heights have not. This is an unusual fact, giving rise to the opportunity of installing co-located wind and wave energy farms, so that the periods during which wind energy is not available might be complemented by energy produced from wave-energy converters. The study has used data to calculate a feasibility index that shows the potential for this type of farm to grow over time. It has also been analysed at a specific location and it has been determined that wind-energy production is likely to increase while wave-energy production might decrease. This further highlights the wind-wave decoupling and strengthens the case for the new approach.
5.3. Wind-wave fatigue loads in offshore floating wind turbines
Generally, wind and wave energy long-term variations are negligible, but the combination of wind-wave energy and the projections of fatigue loads during the last decades suggests the need to study these aspects carefully for future projections.[21]
This research introduces a novel method to analyse fatigue loads on offshore floating wind turbines over extended periods at a relevant grid point of the West of Ireland.[22] The method utilises bias-corrected historical wind and wave data from a high-energy sea location. To manage computational demands, sea states have been clustered into categories, revealing their changes over three climate periods spanning 90 years. OpenFAST[23] software has been used to simulate wind turbine behaviour (two types with different rated power) under various sea state types and these simulations have assessed damage loads and fatigue increase over time, with specific components experiencing a 5%-8% rise in fatigue.
Overall, this new method has employed historical data to create a model representing long-term sea state evolution as well as the corresponding fatigue, applicable for global projections of future floating wind turbines. This will imply a strong impact in the near future because a general increment of fatigue is expected due to the effects of climate change, thus reducing the life-cycle energy production.[24]
Conclusions
Up to 2100, no major global annual variations in electricity production are expected in either the wave or wind energy sectors, across different climate scenarios.
In the field of wind energy, the most relevant changes up to 2100 have been perceived at the seasonal level, specifically in the Arctic and the Southern Ocean, or more locally, in the Bay of Guinea or southern Brazil. In addition, it has been observed that the reduction of freezing hours due to global warming can generate significant increases in wind production in areas such as Iceland, Alaska, Scandinavia or the Baltic Sea.
One of the problems that affect renewable energies is intermittency, so that the mixed use of wind and wave energy allows to mitigate the impact of this problem. It is clear that further research is needed in this field, by mixing many different types of renewable energies and by also opening the door to remote production of hydrogen in order to expand the areas in which renewable energy can be generated, even though they are not directly connected to the electrical grid. To that extent, the optimal sites or hotspots for the location of devices that capture wave and/or wind energy has been analysed.
The analyses shown in the previous pages have been carried out at the highest available temporal resolution, leading to a huge amount of data to be processed. In the near future, more specific data will be available allowing researchers in the field to achieve results at a higher spatial resolution, so that conclusions at the national level will be more representative.
As mentioned above, the analysis of renewable energy resources does not show significant global changes in the near future. However, there are other aspects that must be considered beyond the renewable energy resources as the possible mechanical fatigue generated in the floating wind energy technology by changes in the period of the waves, or even the extreme events that may occur in the medium-long term and whose study is beyond the scope of this work.
[1] This study is part of project PID2020-116153RB-I00 funded by the Ministerio de Ciencia e Innovación/Agencia Estatal de Investigación MCIN/AEI/ 10.13039/501100011033, Spain.
[2] National Renewable Energy Laboratory (NREL), ‘5 MW wind turbines and spar-type flotation systems’.
[5] IEA, ‘Offshore Wind Outlook 2019’.
[6] Roadmap offshore wind and marine energy in Spain.
[7] The Coupled Model Intercomparison Project (CMIP) is an international climate modelling project, designed to better understand past, present and future changes in the climate. A climate model is a complex computer code that creates a digital analogue to Earth. This model digitises the processes and interactions between parts of Earth’s climate system: the atmosphere, ocean, land surface, cryosphere and biosphere.
[8] SSP scenarios: SSP1-1.9 scenario is the ‘very low’ scenario and is associated to an increase of 1-1.8ºC by 2100; SSP1-2.6 scenario is the ‘low’ scenario and is associated to an increase of 1.3-2.4ºC by 2100; SSP2-4.5 scenario is the ‘intermediate’ scenario and is associated to an increase of 2.1-3.5ºC by 2100; SSP3-7.0 scenario is the ‘high’ scenario and is associated to an increase of 2.8-4.6ºC by 2100; SSP5-8.5 scenario is the ‘very high’ scenario and is associated to an increase of 3.3-5.7ºC by 2100.
[9] G. Ibarra-Berastegui et al. (2023).
[10] G. Ibarra-Berastegui et al. (2018).
[11] S. Carreno-Madinabeitia et al. (2024).
[12] To address potential biases in the data, all variables were bias-corrected using the Quantile Matching and Multivariate Bias Correction N-pdf techniques, using for this purpose ERA5 reanalysis data (A.J. Cannon, 2018). Moreover, a self-organising map (SOM) technique was employed to categorise daily sea state frequencies and power (G. Ibarra-Berastegui et al. 2021).
[13] G. Esnaola et al., 2024.
[14] M. Meinshausen et al. (2020).
[15] M. Aizpurua-Etxezarreta et al. (2022).
[16] A. Sáenz-Aguirre et al. (2022).
[17] ERA5. The energy that a standard turbine would produce using its power curve with the existing wind during those 10 years has been calculated. Besides that, using the finite element method –a set of mathematical tools often used to numerically solve complex problems of physics and engineering, particularly those involving partial differential equations–, the energy that would be produced by three different wave energy converters (WEC –the device used to produce electricity from the mechanical energy available in the surface waves which appear in the ocean–) of different geometries, masses and Power Take-Off (PTO) has been estimated. The PTO refers to the mechanism that is in charge of transforming into electrical power the energy absorbed by the primary converter. This primary converter, commonly a chamber or a floating buoy, absorbs the mechanical energy from the oceanic waves and converts it into mechanical energy in the WEC. This must still be converted into electricity, something which is achieved by means of the PTO system.
[18] A. Babarit et al. (2020).
[19] S.J. Peter Hill et al. (2024).
[20] A. Ulazia et al. (2023).
[21] A. Sáenz-Aguirre et al. (2022).
[22] A. Ulazia et al. (2023).
[24] A. Ulazia et al. (2024).
