Theme[1]: Adapting agriculture to climate change requires an understanding of both natural impacts and the underlying vulnerability of socio-economic systems.
Summary: Food production systems, essential to socio-economic activity throughout the world, are beginning to face the challenge of anthropogenic climate change in addition to the challenge of population growth and changing consumer patterns. Uncertainty surrounding climate change impacts, however, poses a serious challenge to agricultural adaptation. Additionally, since the effects of climate change will vary globally, changes in crop productivity will also differ from region to region. Thus, regional adaptive capacity must be considered locally in order to capture underlying socio-economic vulnerability. Our combined analysis of changes in crop productivity and adaptive capacity specifically highlights the seriousness of climate-change-related risks in Africa and South-East Asia. Conversely it is noted that some regions stand to make gains from the anticipated changes in climate.
Analysis
Introduction
The central role of food production in human social and economic systems highlights the importance of anthropogenic climate change impacts on agriculture. A number of impacts possibly associated with climate change such as increased runoff, warming of water bodies, increased soil erosion or drought, among others, are emerging throughout the globe (IPCC, 2007). Hence, there is an increasing demand for adaptation strategies since the effect of changes in agriculture will significantly affect major global and regional economic activity (ibid.).
Establishing policy priorities for adaptation in agriculture requires the sector to deal with an uncertain future. The complexity of the issue is further amplified by the need to understand how local and global vulnerabilities will affect the uncertain future. The combined analysis of natural and socio-economic risks is crucial for adaptation because of the socially-embedded nature of economic activities, particularly agriculture. This ARI presents a global evaluation that incorporates regional responses of land productivity under climate change scenarios and combines these impacts with an evaluation of the inequalities in adaptive capacity between different countries. Finally, the analysis concludes with an assessment of strategic planning processes given the regional variations in natural impacts and adaptive capacity levels throughout the world.
In the following section we present projections of changes in land productivity and show that current inequalities in agricultural production will be maintained or even intensified under climate-change scenarios. Our projections highlight the interrelations between socio-economic underdevelopment and negative impacts on agricultural production. The third section deepens the analysis by looking at the values of the adaptive capacity index for a set of countries in order to determine which factors are the most significant in explaining inequalities in adaptive capacity throughout the globe. The fourth section draws policy lessons from the projected impacts on agriculture and the levels adaptive capacity.
Global Projections of Land Productivity and Irrigation
The ClimateCrop model[2] (Iglesias et al., 2011) projects changes in land productivity under different climate-change scenarios; the results are presented in Figures 1 and 2 and show that there is a consistent distribution of future opportunities and risks despite the considerable uncertainty surrounding future impacts. The results show that the current comparative advantages of agriculture in different regions will either persist or be intensified over time. Additionally, the patterns in the marginal effect of production change are strikingly coterminous with the fault lines of socio-economic development. This suggests that agriculture in poor countries is not only vulnerable because of low investments in, say, technology, but that poor countries are also more likely to suffer from negative biophysical impacts.
Figure 1. Aggregate per cent changes in average land productivity under scenarios A1B[3] for the 2080s compared to current land productivity
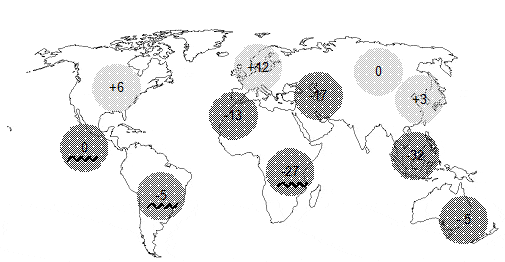
Note: light grey indicates increase and dark grey indicates decrease in land productivity compared to current values. The wave symbol indicates significantly increased variability.
Source: Iglesias et al. (2011).
Figure 2. Aggregate per cent changes in average land productivity under scenarios E1[4] for the 2080s compared to current land productivity
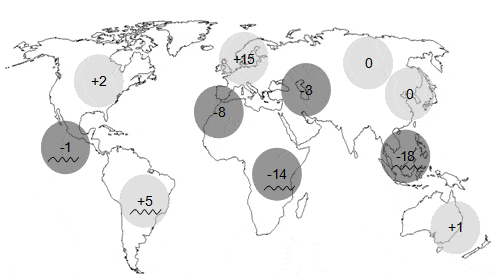
Note: light grey indicates increase and dark grey indicates decrease in land productivity compared to current values. The wave symbol indicates significantly increased variability.
Source: Iglesias et al. (2011).
Figures 3 and 4 show per cent changes in the demand of water for irrigation in order to maintain current food production in the 2080s. The calculations of irrigation demand within the ClimateCrop model include some assumptions about technological development that limit how much area may be irrigated. If a country has very high irrigation efficiency based on advanced technology (eg, Israel), a reduction in water availability will imply a reduction in irrigated area while maintaining the same level of productivity per area unit (thereby keeping competitiveness on agricultural markets constant). If a country has the scope to improve its water efficiency and can afford the required technology (eg, Spain), a reduction in water availability will be compensated by an increase in irrigation efficiency. If a country can improve its water efficiency and cannot afford the required technology (eg, Morocco), farmers will be exposed to a loss of productivity due to the deficit in the water supplied. In all cases, the available amount of irrigation water varies yearly and therefore any water-limited scenario implies a greater exposure to risk compared with the unlimited case. Our results hint at the further challenge to future water resource management embodied in potential conflicts over competing water needs. Particularly in areas where water resources are shared across borders, the geo-political implications may become considerable in the event of increasing water needs being mismanaged.
From this set of results it can be seen that maintaining ecosystem and environmental flow requirements in watersheds that provide large amounts of food is likely to be a challenge in the future. Africa and South-East Asia stand at a crucial juncture in terms of water management. Water security in these regions is undermined by a lack of available technology and investments in the water sector. Additionally, increasing population pressure and development concerns also place an additional stress on available water resources. From the perspective of water managers, the process of negotiating between competing demands will become increasingly complex.
In theory, water for irrigation should be given priority in low-income countries because of the high multiplier effect a prospering agricultural sector can have on a developing economy; thus, for instance, in drought-prone areas of Zimbabwe investments in irrigation could greatly increase the value of agricultural production in economic terms. Nevertheless, in such countries, large-scale irrigation, inter-basin water transfer and high-technology desert-irrigation are problematic solutions to the issues of famine and food-aid dependence given the associated high investment costs. At the moment, only a small percentage of African crop yields are produced through irrigated agriculture and growing urban and industrial demands are already limiting the amount of water available for irrigation.
Figure 3. Aggregate average percentage changes in water demand for irrigation under scenarios A1B for the 2080s compared to current water demand
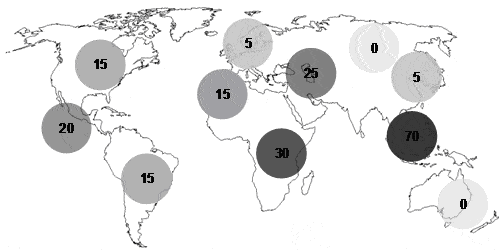
Note: in Figures 3 and 4 all average per cent changes in water demand for irrigation are positive and darker colours indicate higher water demand.
Source: Iglesias et al. (2011).
Figure 4. Aggregate average per cent changes in water demand for irrigation under scenarios E1 for the 2080s compared to current water demand
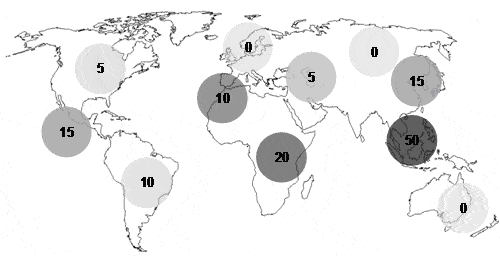
Note: in Figures 3 and 4 all average per cent changes in water demand for irrigation are positive and darker colours indicate higher water demand.
Source: Iglesias et al. (2011).
Regional Adaptive Capacity Index and Drivers of Inequality
One of the key issues in climate change research is to define the extent to which climate-change impacts and their interactions with social systems will increase the vulnerability of agricultural systems. To analyse the dampening effects of societies on climate-change impacts we develop and apply an adaptive capacity index. Adaptive capacity is understood to be the capacity of a system to cope with or recover from a potentially damaging change in climate conditions, and is a useful concept for understanding the responses of a system to future perturbations, such as those associated with climate change. Here we compute an adaptive capacity index (ACI) that integrates determinants of policy in a country or region, based on the aggregate social, economic, technological, environmental and climate components of adaptive capacity (Table 1). The value of the index for any given system represents the potential adaptive capacity of that system. In other words, a higher score on the index represents a greater ability to modify future climate impacts.
Table 1. Components and proxy variables of the adaptive capacity index for the agriculture sector.
Components | Proxy variables |
| Natural capacity | Average precipitation 61-90 (mm/year) Total water use (per cent of renewable) Agricultural water withdrawal (per cent of total water withdrawal) Area with salinisation by irrigation (ha) Population density (people per km2) |
| Economic capacity | GDP (millions of US$) GDP per capita (US$) Agricultural value-added/GDP (per cent) Energy use (kg oil equivalent per capita) Population below poverty line (per cent of population with less that US$1/day) |
| Social capacity | Agricultural employment (per cent of total) Adult literacy rate (per cent of total) Life expectancy at birth (years) Population without access to improved water (per cent of total) |
| Agricultural innovation | Irrigated area (per cent of cropland) Irrigation technology (per cent drip irrigation) Fertiliser consumption (100 gr/ha of arable land) Agricultural machinery (tractors per 100 km2 of arable land) |
Source: Iglesias et al. (2011).
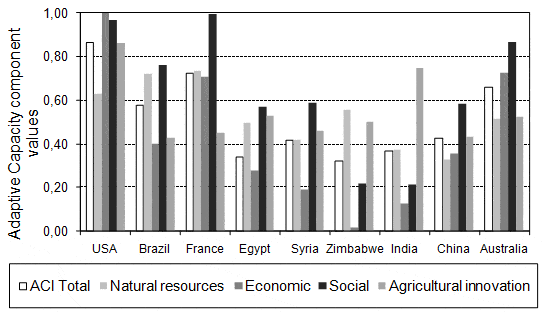
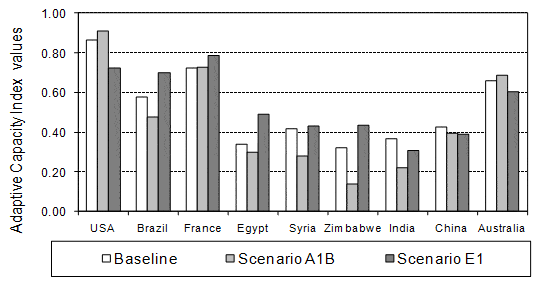
The evaluation of adaptive capacity at country level conceals important local disparities. However, considering that policies to facilitate adaptation are often initiated or promoted at the national level, the analysis presented provides a first approximation of the overall capacity of a country to adapt. Because the adaptive capacity index is a component-based analysis it provides insights into a few aspects of how adaptation to climate change might be prioritised in different countries. First, the results under current climate, economic, social and demographic conditions (Figures 5 and 6) quantify the country-specific relation between socio-economic development and adaptive capacity. Secondly, the results under future climate indicate that the overall climate risks might also play a major role. Thus, for instance, a country like Brazil is likely to see a boost in economic capacity under a scenario of stabilised emissions, in which it will be able to develop its economic potential more fully. On the other hand, richer countries such as the US, France and China are less likely to see swings in their level of adaptive capacity given the large size of their economies and their potential to further invest in technological innovation in agriculture. Finally, poor, agriculture-dependent countries such as Zimbabwe show a greater variability for future levels of adaptive capacity. This can probably be explained by the fact that under more severe climate change impacts (scenario A1B) the economic benefits from agriculture will be hard hit. On the other hand, under a more stabilised scenario increases in population and life expectancy will contribute to a higher GDP.
Figure 5. Component scores of the adaptive capacity index for selected agro-climatic regions at the baseline
Source: Iglesias et al. (2011).
Figure 5 is a snapshot of current adaptive capacity levels and shows the values for the different components –the results clearly show the large differences in ACI scores and how these are affected by the values of the components–. Figure 6 shows how the inequalities in levels of adaptive capacity persist over time under two different climate scenarios based on different storylines.
Figure 6. Adaptive capacity index values for baseline, scenario A1B and scenario E1
Source: Iglesias et al. (2011).
The components of adaptive capacity are responsible for driving the inequalities in adaptive capacity values for different countries. Therefore, to explore the drivers of inequality we apply the GINI index methodology (Figure 7). Using this method the percentage of countries –sorted by index values from low to high– is plotted on the horizontal axis (x), while the percentage of the accumulated index values is on the vertical axis (y). The curves represent the x per cent share of the countries concentrating the y per cent of the accumulated ACI values. Here we apply ‘Lorenz curves’ to explore the disparities in the adaptive capacity among countries. The perfectly equal distribution is represented by the straight line y = x, usually known as the line of perfect equality and this would be the case in which every country has the same adaptive capacity. [5] The Gini coefficient is the area between the line of perfect equality and the observed or estimated ‘Lorenz curve’. The larger the area, the larger the disparities observed. The results show that social and economic factors are key drivers of inequality in current and future adaptive capacity. In other words, the potential for adaptation in any given country shows that the socio-economic components are mainly responsible for the disparities in adaptive capacity values in different countries. This result has important and controversial implications for policy and decision making in face of climate change –particularly for agriculture since the results imply that prioritising agriculture may not be the preferred adaptation option–. Instead, boosting socio-economic development may lead to increased resilience in the face of climate-change impacts. For instance, in Zimbabwe, prioritising adaptation policy per se may be less efficient than boosting social and economic indicators in order to reduce the damage caused by climate change impacts. This observation is supported by the ‘Lorenz curves’ in Figure 7, where economic and social capacities are consistently responsible for the largest differences in adaptive capacity over the three scenarios considered.
Figure 7. Lorenz curves showing inequality in distribution of adaptive capacity components under baseline, A1B and E1 scenarios

Source: Iglesias et al. (2011).
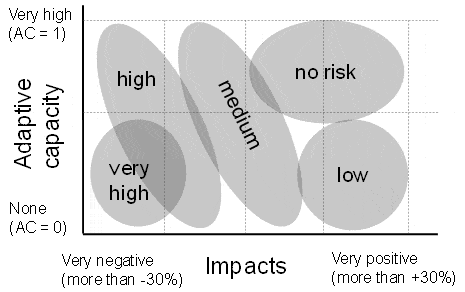
The combination of adaptive capacity and climate impacts influences the global distribution of vulnerability. To demonstrate this insight we take into account the two dimensions of risk: projected changes in productivity and social vulnerability. This simple approach can inform policy on potential adaptation measures by taking into account regional variation and underlying causes of risk in order to define broad groups of risk profiles (Figure 8). Overlapping areas suggest how levels of risk may be heightened or dampened depending on the availability of water resources, among other factors.
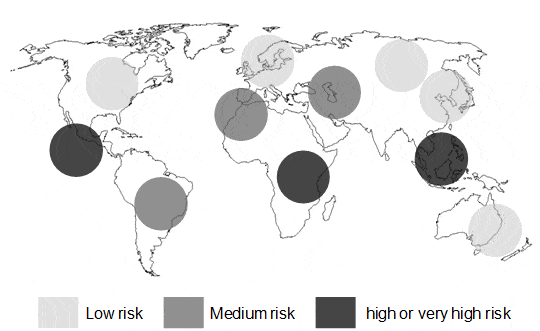
Figure 9 shows how these risk profiles are mapped onto the world given the results of our analysis. In regions where adaptive capacity is high, negative climate-change impacts will be dampened resulting in lower levels of risk; this may be the case of the Mediterranean region of Europe or Australia. On the other hand, regions such as South-East Asia and Africa will be under great risk from climate change because of low levels of adaptive capacity and very negative projections of agricultural productivity.
These risk profiles demonstrate that successful adaptation policy needs to address the two risk components under consideration by supporting strategies that are region-specific and provide sufficient flexibility in the face of impacts, and create synergies with development policies that enhance adaptive capacity.
Figure 8. Definition of risk profiles as determined by projected changes in productivity and levels of adaptive capacity
Source: Iglesias et al. (2011).
Figure 9. Mapping of profiles as determined by projected changes in productivity and levels of adaptive capacity
Source: Iglesias et al. (2011).
As an example of policy development we compare two regions with differing risk profiles: South-Eastern Africa and Mediterranean Europe. In South-Eastern Africa climate change threatens agricultural productivity and water resources. At the same time, the socio-economic components are the weakest of the adaptive capacity. This means that future policies need to broadly target developmental concerns and decrease inequality, for instance, by improving access to water resources. In contrast, in the Mediterranean the main challenge for agriculture in the future is water availability and the weakest component of adaptive capacity is the natural resource component. This suggests that drought management plans need to be a policy priority. Given the high levels of socio-economic development in the region, adaptation may take centre stage as a policy priority. In both of the regions considered here, adaptation solutions will necessarily require the involvement of different policy actors –NGOs and local education or health boards will be key actors in South-Eastern Africa, while national and local government agencies are likely to be in charge of adaptation policy in the Mediterranean–.
Nevertheless, it is worth remembering that, given the costs and lack of incentives associated with promoting adaptive capacity, adaptation is unlikely to be facilitated through the introduction of new and separate policies. Rather, the revision of existing policies that currently undermine adaptation efforts and the strengthening of policies that promote it will be a more effective strategy. Finding common ground between competing claims is a serious challenge to policy development. Therefore, and in the light of future international climate agreements, priority should be given to those policies which may strengthen pre-existing adaptation policies and ensuring that adaptation is mainstreamed into the policy process while not requiring a separate area of policy focus.
Conclusions: Despite many assumptions and uncertainties associated with this global assessment, the above analysis provides insights about the future of agriculture in a changing climate. Moreover, our analysis demonstrates the importance of understanding land productivity changes and consistent water-demand changes. These estimates define the regions of concern and their relative importance in the coming years. In terms of our results, the high degree of agricultural risks in Africa and South-East Asia appears particularly striking, since agricultural systems in these regions appear vulnerable under all the criteria considered. The results also highlight several regions where climate change may create opportunities for greater production. Nevertheless, the relationships between our estimates and environmental constraints may be improved, and therefore future work in this regard is necessary.
The broad analysis presented here was intended to identify some insights for the questions: how can agriculture deal with an uncertain future?; how do local vulnerabilities and global disparities respond to this uncertain future?; how do we prioritise adaptation to overcome the resulting future risks? We show that global projections of land productivity and changes in irrigation under a range of climate projections provide robust information about regional changes in an uncertain future. Our analysis on adaptive capacity sheds light on the drivers of inequality and is useful for responding to the question of how current vulnerability is likely to change under future scenarios. Finally, the analysis of adaptation is useful for identifying priorities to overcome future risks.
Ana Iglesias
Universidad Politécnica de Madrid, Spain
Sonia Quiroga
Universidad de Alcalá, Spain
Agustín Diz
Universidad Politécnica de Madrid, Spain
[1] A full discussion and analysis of this topic can be found in A. Iglesias, S. Quiroga & A. Diz (2011), ‘Looking into the Future of Agriculture in a Changing Climate’, European Review of Agricultural Economics, vol. 38, nr 3, doi: 10.1093/erae/jbr037. A full evaluation and overview of climate change science and impacts is available in IPCC (2007), Climate Change 2007: Fourth Assessment Report of the Intergovernmental Panel on Climate Change, Intergovernmental Panel on Climate Change, Cambridge University Press, Cambridge.
[2] The ClimateCrop model bridges the detailed evaluation of process-based models at the site level and empirical production functions at the wider scale based on temperature and precipitation data from 1,141 meteorological stations. Major improvements in the ClimateCrop model include estimations of nitrogen and water demand elasticities for the major agro-climatic regions.
[3] A1B scenarios place a balanced emphasis on all energy sources and assume CO2 Emissions of 712 ppm.
[4] E1 scenarios represents stabilisation of emissions at 498 ppm of CO2.
[5] In the analysis of adaptive capacity the different expected impacts are not taken into account. However, the next section presents a combined analysis of projected impacts and adaptive capacity.

