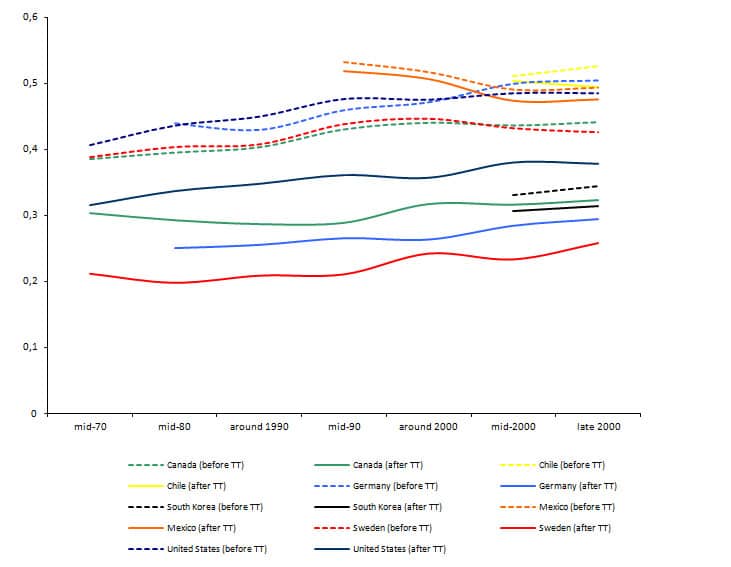
 What does the following graph tell us? Well, quite a few things.
First, that domestic inequalities have been rising (at least for the countries plotted) for a few decades now. So yes, maybe equity is another victim of the current crisis and income dispersion has increased faster in the past few years; but it was already there (and rising). Secondly, that some countries show a wider gap (than others) between their Gini coefficient before and after tax and transfers. In other words, fiscal policy may play a role in lowering income inequality and this role might be more or less efficient, depending on the country.
Third, that despite fiscal policy, for these seven countries there appears to be a parallelism between the two trends (Gini coefficient before and after taxes and transfers). Fiscal policy can partially correct inequality but it does not seem powerful enough to reverse a trend: a structural trend towards lower equity before transfers and taxes seems to mean a similar structural trend towards lower equity after transfers and taxes.
Gini coefficient:
the increase in inequalities and the efforts of governments to reverse them

